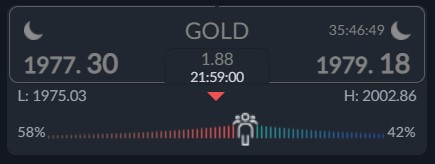
Gold continues to consolidate below the $2,000 level as the yellow metal benefits from worries about Deutsche Bank, following the recent spike in Credit Default Swaps for the German bank.
Gold rallied towards the $1,980 area, but crucially it continues to struggle above the $2,000 level which could hint that a much deeper price correction may be coming before gold starts to break higher.
After Credit Suisse shares have recovered recently but now Deutsche bank share are under pressure from the borrowing costs, it is likely to make traders hold more gold instead of euros.
Gold is likely to remain in favour, and trade higher, as worries spread across financial markets with all major indexes falling sharply. The only issue for gold would be a risk-on rally.
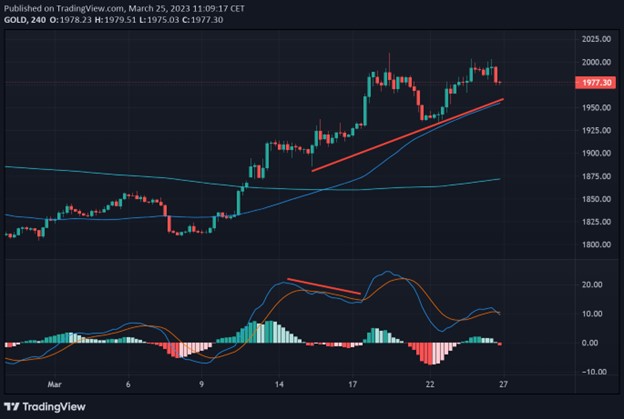
A correction to $1,880 could happen due a number of technical divergences as I will discuss in more detail on the technical analysis section below.
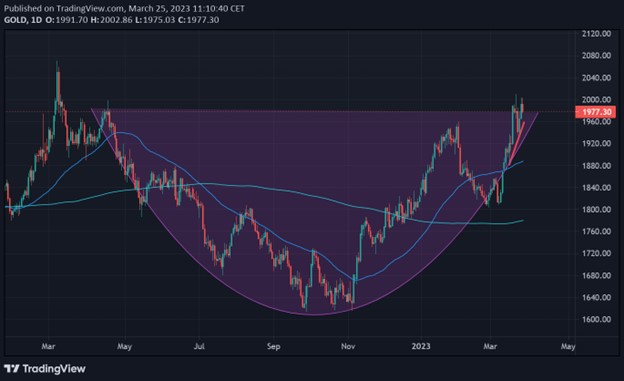
However, even if a dip does take place I think gold is going major bull trend and traders will move away from the US dollar this year and move into gold, with the yellow metal eventually hit $2,300 and much higher.
Current sentiment metric towards gold shows that sentiment has become more bearish all of a sudden, which hints that this current move back to the $2,000 level could eventually be sustainable.
The ActivTrader market sentiment tool shows that 42 percent of traders are bullish towards gold. Going forward, we really need to see a much strong negative bias by retail to help the chances of a sustained rally to $2,000.
Gold short-term Technical Analysis
According to technical analysis gold the price of gold has moved above its 200-period moving average on the four-hour time frame, meaning that the short-term price trend remains very bullish above the $1,950 level.
It is also noteworthy that gold has formed significant amounts of negative MACD price divergence, which extends toward the $1,880 support level.
Gold Medium-term Technical Analysis
The daily chart shows that the yellow-metal has moved back inside its two-year range and bounced its 200-day moving average, around the $1,780 support area.
We could see the price of gold making new highs if it ignites the cup and handle pattern as depicted in the chart below. Gold could explode above the $2,000 level and then hit the $2,300 level with relative ease.