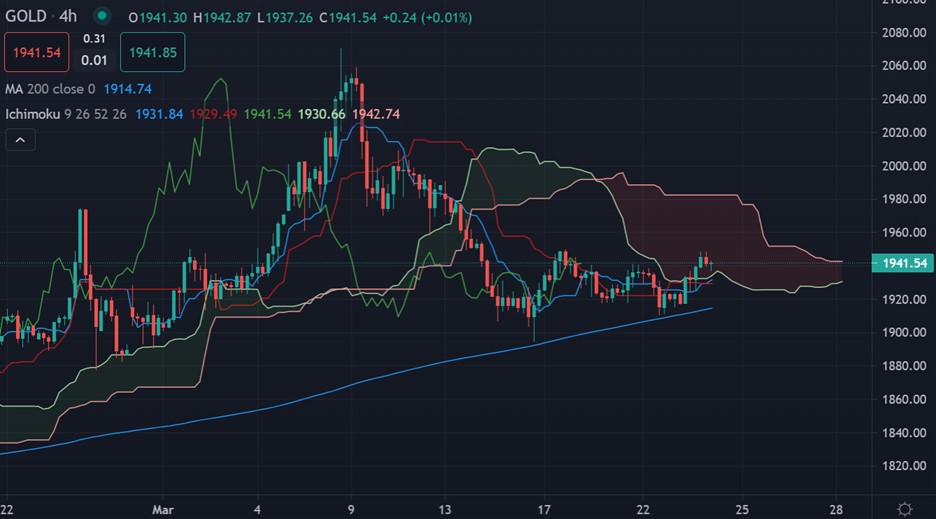
Market participants are keenly watching US 10-year rates as they approach a trend-channel that has served multi-decade-long resistance. Gold prices are also incredibly resilient despite the explosive price action in rates markets following Chair Powell’s comments.
The price of gold is back above support in mid-week trading after US stocks fell sharply following Moscow’s plans to switch its natural gas sales to some countries to roubles., which hurt risk-on sentiment.
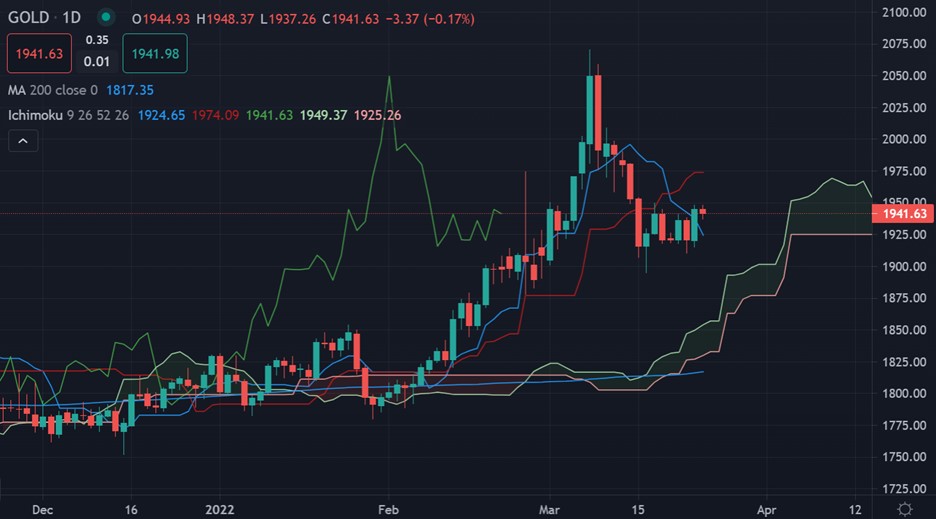
Naturally this has sent commodity price higher. The yellow metal rallied from a low of $1,915 earlier this week, and is set on a fresh multi-day high, close to the $1,950 resistance level.
As tensions in Ukraine escalated, it is likely going to put additional upward pressure on already high inflation due to supply chain bottlenecks, and commodity prices. Rising inflation has led many central banks to take steps to rein in prices, such as by raising interest rates.
Gold can also benefit further in the near-term from the safe haven flows amid the uncertainties surrounding the war. The same can also be said for silver, which performs well in war times.
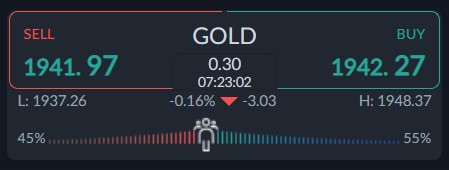
Current sentiment metric towards gold show that traders are becoming less bearish over the last forty-eight hours. The ActivTrader market sentiment tool shows that only 45 percent of traders are bullish towards gold.
While this is a minor sentiment drop, it is very bullish for gold price that after retail are feeling less bullish towards gold prices. This has potentially been one of the things that has stopped silver prices rallying, as huge amounts of retail participants are bullish towards silver.


