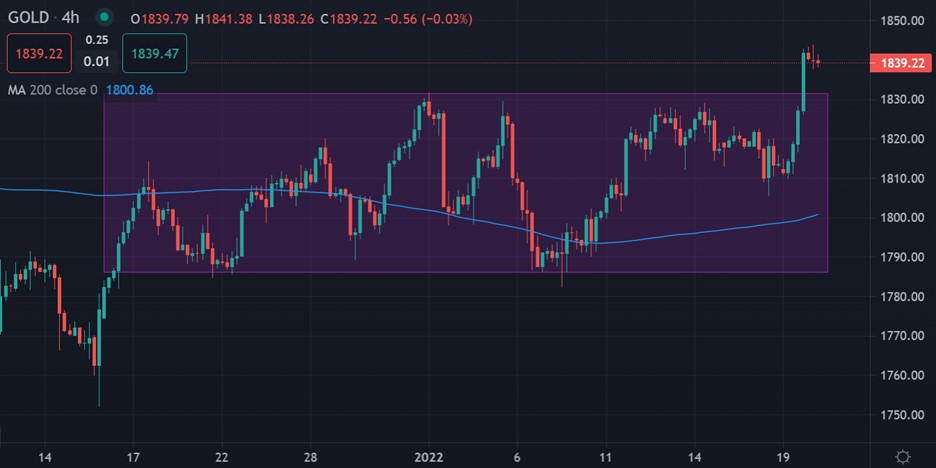
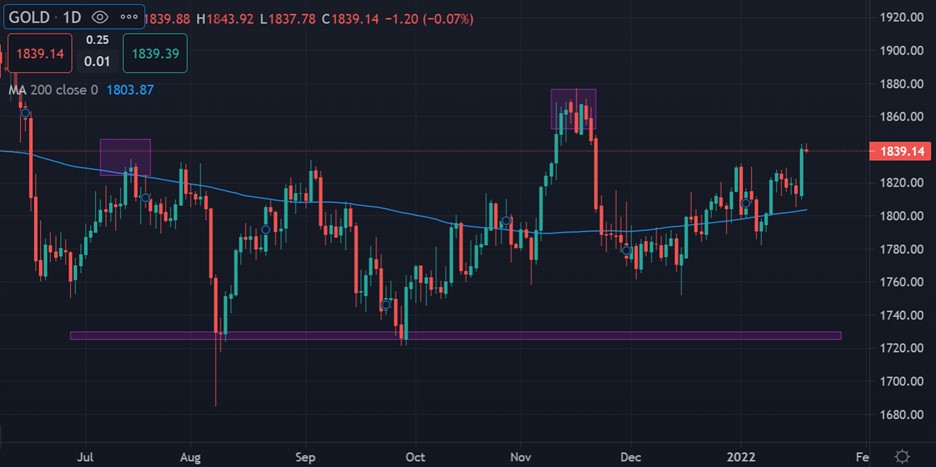
Gold has staged a major breakout above key resistance overnight, specifically the technically important $1,830 resistance level. This key technical area has been a price zone that gold bugs have not been able to break for months, and now it’s broken, gold price is looking higher.
Numerous technical rejections from this area, denoted by a key falling trendline on the monthly time frame have traders watching this area closely. Further gains towards $1,870 and $1,930 are now very plausible.
Gold price briefly disconnected from the price action in the Treasury yields on Wednesday but has returned to its negative relationship with the US rates this morning as bulls consolidate around $1,850.
China’s policy easing driven risk-on mood also limits gold’s gains for now. Although decade-high inflation rates globally have gold bulls excited, while the Russia-Ukraine crisis also helps keep the buoyant tone intact around the safe haven.
The yellow metal has arguably benefitted from early-year seasonal trends in 2022, i.e. Chinese new year gold buying, which is only going to accelerate as the holiday season approaches.
Bitcoin’s weakness is also bullish for gold. Many people may have bought their relatives Bitcoin last year. But with BTC falling, and gold rising, speculative bets towards gold seem to be back more attractive.
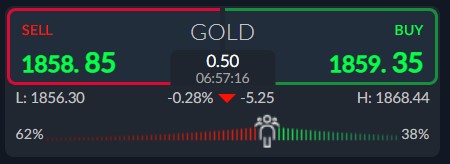
The current sentiment metrics towards gold show that traders are becoming more bearish. The ActivTrader market sentiment tool shows that only 38 percent of traders are bullish towards gold.


