The price of gold moved to its highest trading level since March 1st yesterday, following renewed US dollar selling and a supportive fundamental backdrop for gold, namely continued low US interest rates and more QE.
Wednesday’s dovish FOMC meeting set the scene for more gold strength, as the yellow metal attempts to build on its early month gains, following its worst monthly performance on the metals market in over a decade.
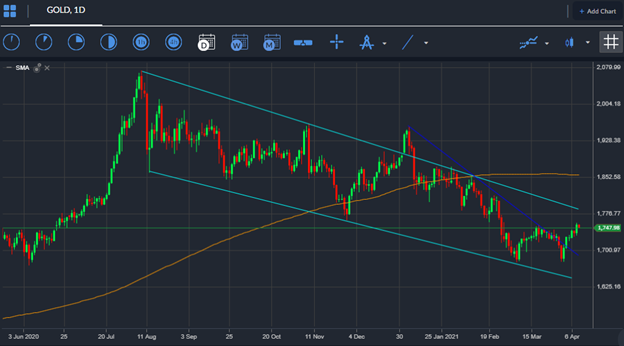
Gold surged above the former key swing-high, around the $1,755 level yesterday, setting the stage for a new short-term bullish trend. Buyers now have to rally gold back above the $1,855 level in order to official restore the metal above its key 200-day moving average.
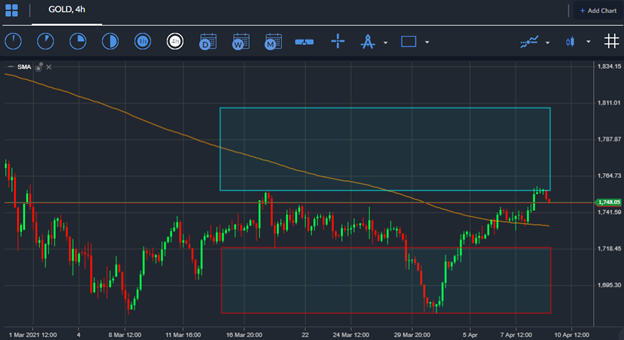
The yellow-metal started to move above its 200-period moving average on the four-hour time frame for the first-time since early-January earlier this week, which hinted that short-term bulls may be preparing to attack above the $1,755 level.
In terms of near-term hurdles, gold now needs to crack its 50-day moving average, around $1,760, and its 100-day moving average, at $1,810. It is likely that is bulls gain strength above the 50-day then a test of the 100-day will follow.
Looking for potential red flags, bearish price divergence has formed across a number of key technical indicators. Both the Momentum and the MACD indicator are showing significant negative price divergence extending down towards the $1,720 level.
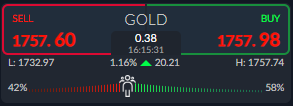
Current sentiment towards gold on the ActivTrader Market Sentiment tool shows that traders are still bullish towards gold with sentiment at 58 percent positive, while some 48 percent of traders are bearish towards gold.
This is bullish because positive sentiment has been dropping over days while the price has risen. Fading what retail traders are doing has historically proved to be a profitable strategy.


