The price of gold is starting to recover higher due to broad-based US dollar weakness and inflation fears. Precious metals are coming back into favour from central banks, as recent data showed record central bank buying.
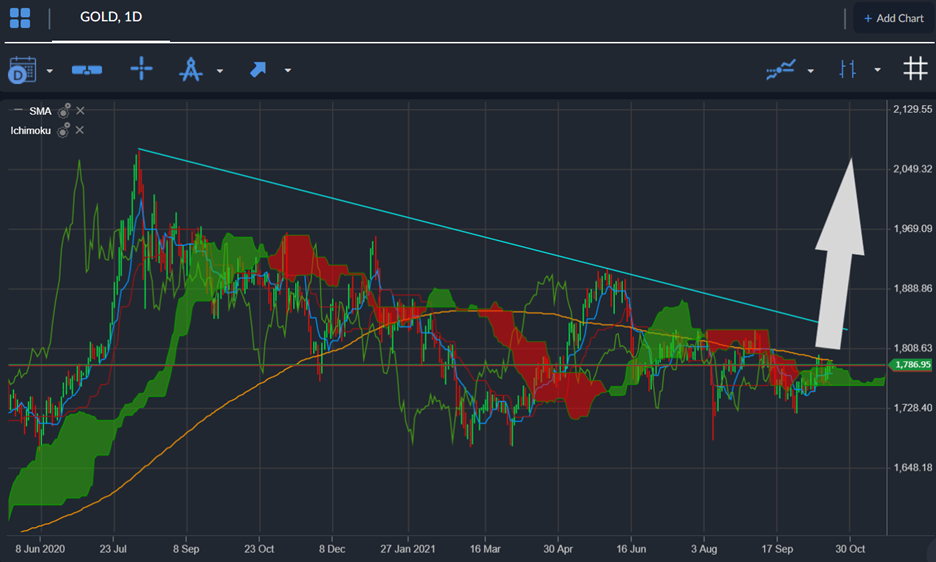
The big breakout lower in the US dollar index has caused technical strength in gold above the $1,1770 level, meaning the recovery is not yet over for the yellow metal, and especially according to long-term technical analysis.
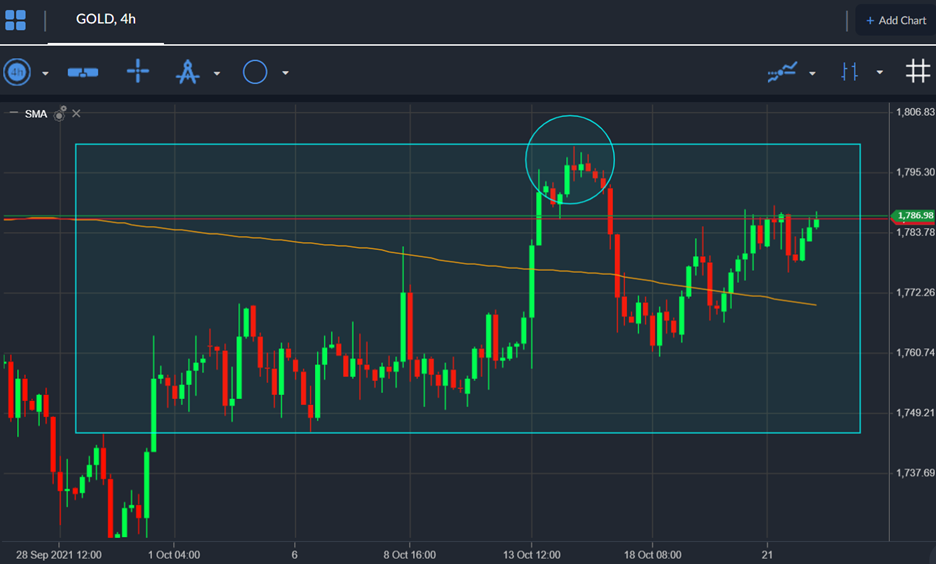
Gold bounced from a critical spot last month, meaning the $1,720 to $1,730 price area, and has rebound back towards the $1,800 resistance level, which is a hugely technical breakout out.
Firstly, the $1,800 level is the head of a large head and shoulders pattern, which holds a downside projection of $50.00. Personally, I think the chances are high that the pattern could be invalidated.
Secondly, we need to take a close look at the Parabolic SAR indicator. The weekly Parabolic SAR will flip to bullish for the first-time since June if the price crosses the $1,800 resistance level.
Earlier this month tentative signs of a major price floor were forming after the $1,720 price area held, providing a clue that a big bounce could be soon. Overall, watch out for a coming rally to the $1,850 level, and possibly even $1,900.
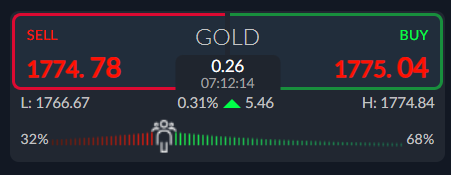
Current sentiment metric towards gold is suggesting further short-term losses are still likely. The ActivTrader market sentiment tool shows that 68 percent of traders are bullish towards gold.


