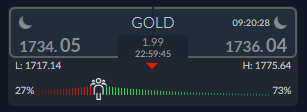
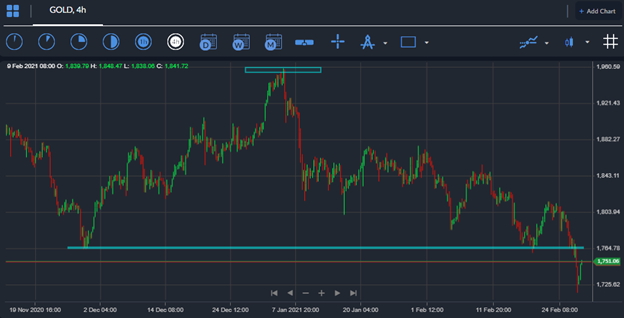
The price of gold crashed on Friday, sending the yellow metal to a new 2021 trading low, and raising fears that the bull market in gold could be over. Gold loss of $40.00 towards the end of last week after breaking through the technically important $1,760 support level.
Traders shunned the yellow-metal and moved into other industrial metals as non-yielding asset classes got crushed by the rise in US bond yields last week. Going forward, good US economic data is likely to be bad for gold.
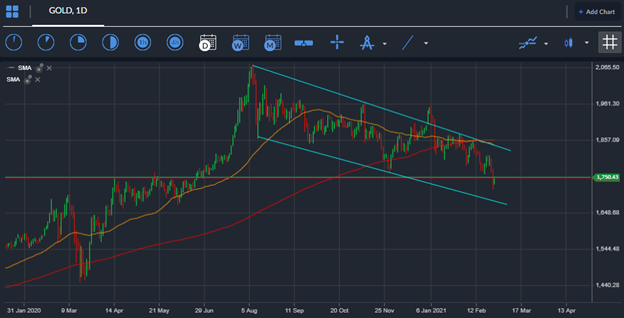
Warning signs had been emerging all month, following multiple failed bids by bulls to hold the number one precious metal above the $1,800 level. The technicals now show that gold could fall towards the $1,675 level before a meaningful recovery takes hold.
Going into this week the release of the ISM manufacturing report, and a key speech from FED Chair Powell, and the release of the Non-farm payrolls job report all have the ability to accelerate or reverse the ongoing bearish trend in gold.
Traders should remember that the price of gold could receive a pop if the $1.9 trillion bill is passed through US senate. Democrats have committed to getting the bill approved by early-March. The announcement could certainly give gold prices a temporary pop.
Any hint that the FED are going to quell the ongoing moves in US bond yields, particularly the 5 and 10-year yields should also be bullish for gold. Until this happen the yellow metal could be in for more weakness.


