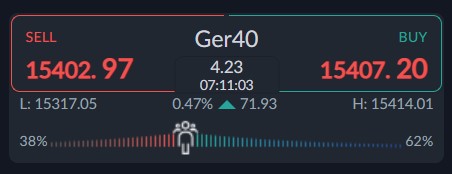
The German DAX is starting to test back above the 15,400 level as indices across the globe start to bounce back after an initial sell-off, sparked by concerns over the derailing of the Build Back Better deal.
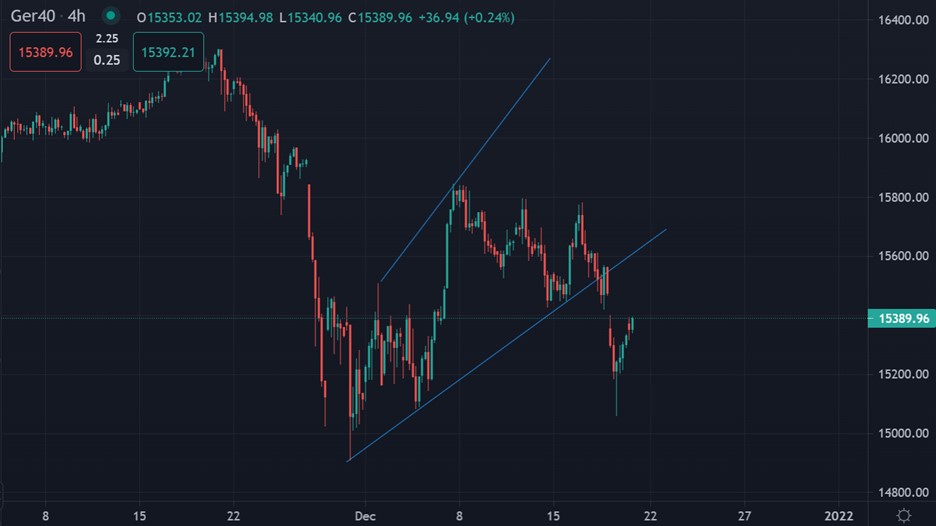
Additionally, the GER40 was able to post a bullish double-bottom on the chart, after selling failed to crack the December low. Double-bottom patterns often spark major price rebounds..
Stock markets across the globe are experiencing a pop again this morning following reports that Sen. Joe Manchin and President Joe Biden spoke Sunday night after a major blow up in negotiations around the president’s domestic agenda.
Apparently, the conversation ended with a sense that negotiations would, in fact, resume around the Build Back Better Act in some form in the new year. This is sparking some hope that the deal can be put back on track in the new year.
According to the GER40 lower time frame, bulls are likely to test towards the 15,500 area in the coming area. Typically, this key technical region has been a key swing area for the leading German Index.
Looking at sentiment towards the DAX, a slight bullish bias is in play with 62 percent of traders expecting more gains. This provides fertile conditions for a continuation of the rally, as traders are still bullish, but not overly, meaning the sentiment skew is not too one-sided.
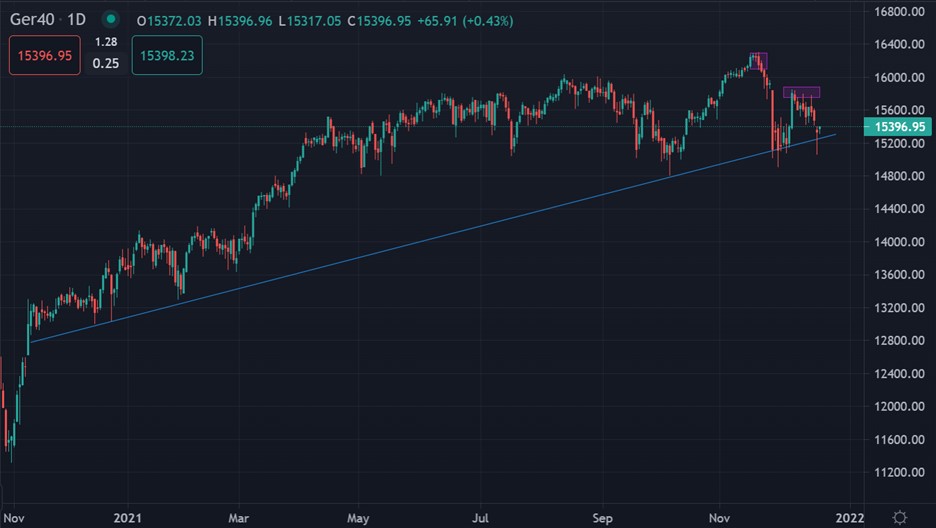
Overall, if bulls are unable to get past the 15,500 area in the coming trading days it should be raising a red flag for perma GER30 bulls, that a further move lower could be coming. A break past this area, and the Ger40 could be testing back to 16,000 sooner rather than later.


