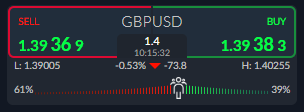
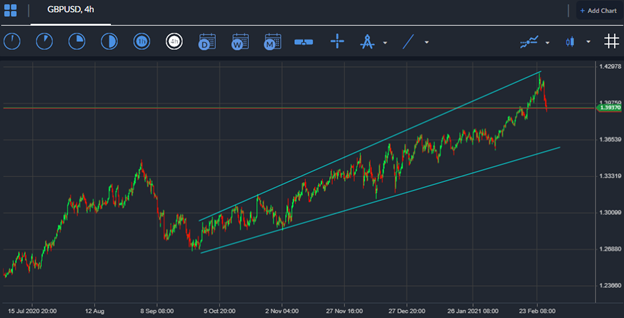
The British pound currency has staged a huge reversal against the US dollar, with the GBPUSD pair dropping nearly three-hundred points from its yearly trading high, which was set earlier this week around the 1.4240 level.
Major moves in the US bond market finally caught up with sterling, as the speedy advance in the US 5 and 10-year bond yields spooked currency traders and caused a flight back into the greenback.
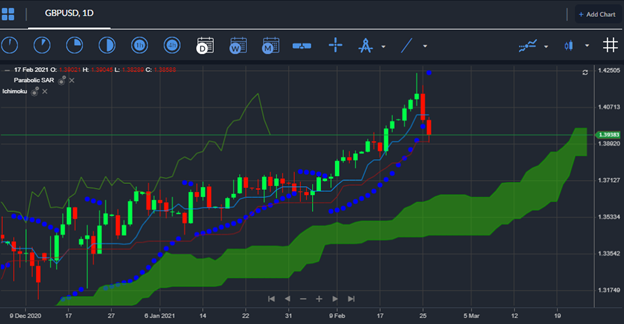
From a technical perspective the GBPUSD pair looks vulnerable to unwinding further while capped below the 1.4000 handle. Especially if we start to see the US dollar long trade gain momentum and regain its positive correlation with rising US bond yields.
HSBC bank has also put a cautionary note to investors this morning and stated “Momentum is clearly a powerful force in FX, but we have built a value case for why the GBP is overstretched and that case does not change until the fundamentals behind it change. For a currency, the danger in exceeding your grasp is not that you reach heaven but that you get a nasty fall back to reality when the momentum wanes.”
Something else to consider is the FTSE 100. Should we see less demand for stocks then the benchmark UK 100 index could suffer further. HSBC noted “UK equities remain a laggard suggesting that it is not foreign equities inflows driving GBP outperformance.”
Sterling tends to underperform when the S&P 500 performs badly. The GBPUSD pair has been increasingly correlated to the performance of the S&P 500 over recent months, especially on risk-off and risk-on days.
If we see the US indices remaining under heavy downside pressure then sterling could unwind even further. This may suggest that some type of interim price top was formed this week when the GBPUSD pair hit 1.4240.


