Forex Analysis GBPUSD
See real-time quotes provided by our partner.
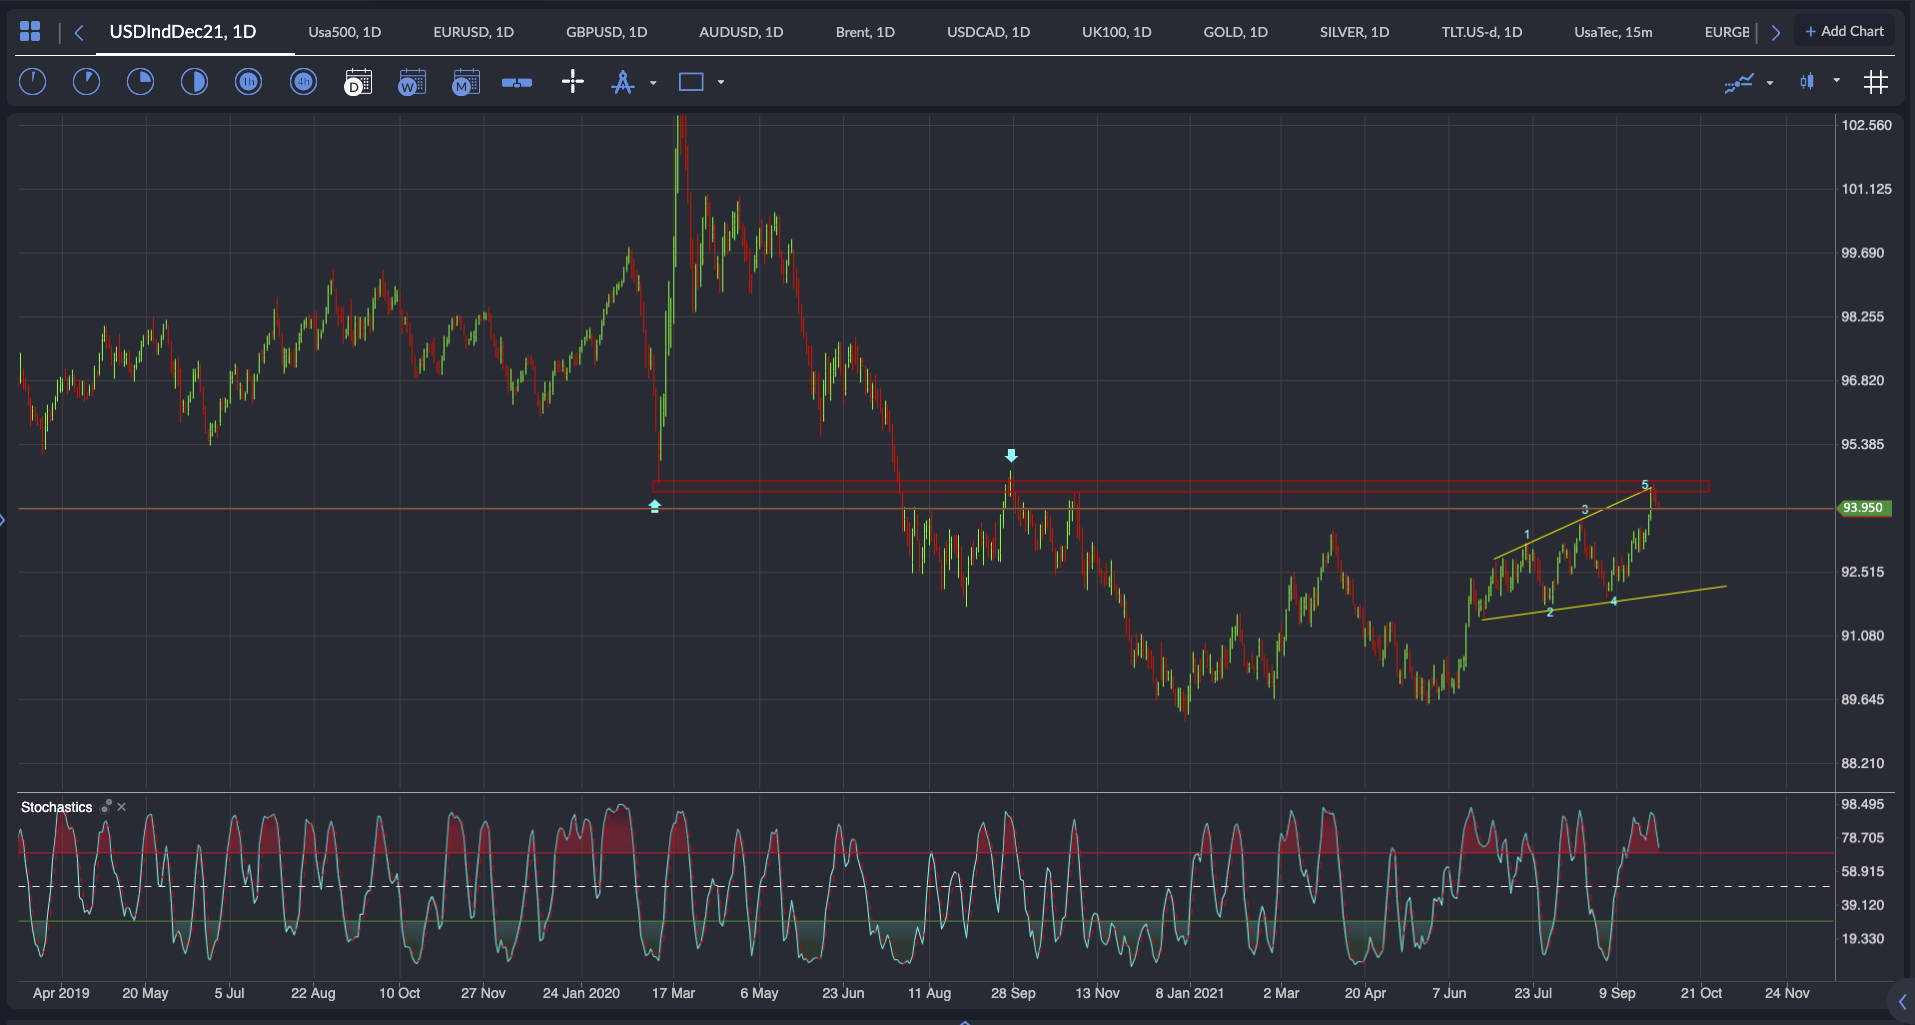
The DXY traded mostly sideways at the beginning of September, though the USD’s overall climb last month was supported by risk aversion about the distressed Chinese property developer Evergrande’s default and the US Debt Ceiling deadlock. The chart above shows an expanding triangle with 5 internal waves that have now completed, with the DXY stalling at $94.50 which is a major resistance level.
The rollercoaster ride for US dollar traders has also been on the back of remarks around the monetary policy from the Fed, with the markets initially waiting on the September FOMC meeting before the DXY rose 0.3% when the FOMC projection for the first-rate hike moved forward from 2023 to 2022.
The August US nonfarm payroll report came in at 235k, below expectations of 735k, and briefly dragged down the USD, but the Federal Reserve was less concerned about the miss, even though their mandate includes maximising employment. Since all of that happened several Fed officials reiterated Powell’s message later that a taper could come in November. So now we’re back waiting to see if the non-farm payroll and ADP numbers this week will give the Fed confidence to press ahead with a move towards normalising monetary policy.
The chart pattern suggests that the US dollar comes back down towards $92 again, but the trend and monetary policy expectations suggest we see a higher US dollar.
See real-time quotes provided by our partner.
The pound had suffered at the hands of the strengthening greenback and then several macroeconomic issues affecting the UK, including a delivery driver shortage. The drop in the GBPUSD also translated into an appreciation in the EURGBP. Over the weekend, the Telegraph reported that the UK has drafted plans to replace the NI protocol, which will be announced at the Tory Party Conference by Lord Frost. There is likely to be a response from the EU which will be detrimental to the UK and so the Bank of England will have to weigh up the consequences of tapering or tightening policy into a possible stagflation environment made worse by tensions across the channel.
At the end of September, the GBP fell by 2.0% against the USD hitting fresh YTD lows. For the first half of the month, the currency traded in a relatively subdued manner, before it was hurt by the USD’s ascent and the market turmoil caused by the energy crisis in the UK.
In any future tightening, the MPC said it would raise rates even if the stimulus had not yet been withdrawn, opening the door to a rate hike before the year’s end. Last week we spotted a possible bullish reversal as the pound versus the dollar looked overdone.
Looking at the ActivTrader sentiment indicator the retail traders on the platform have found reason to become more bullish, so I am thinking these traders may get shaken out at the next test of resistance.
See real-time quotes provided by our partner.
The 1.3600 level is the most obvious level for resistance to hold with another key level up around 1.3740. There are also the daily moving averages to consider as dynamic support with a recent bearish cross of the 50 coming under the 200 period ema.
The path of least resistance appears to be to the downside for the GBPUSD and it may be wise to take profits, if you are long, at the next levels of resistance. Momentum and price action in the daily time frames suggest lower prices are to be expected. Overall, I think the BoE will give the pound relative strength against its peers and the speed and direction in the short term move of GBPUSD will ultimately be down to which way the US dollar travels. If we could get a new swing high and follow up with a higher swing low, this would then give me confidence to start looking for trades to the upside long term.