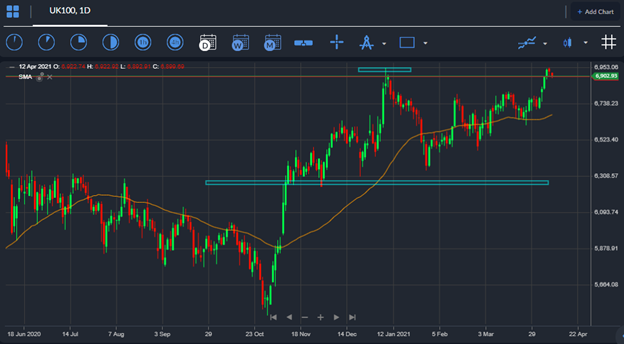
The UK 100 traded to its highest level since the start of the COVID-19 pandemic last week, as blue-chip companies led the gainers in the leading UK index, and by all intents and purposes had their best weekly performance since January this year.
The FTSE250 also hit a new all-time high last week, as Page hiring posted strong results which showed that the UK jobs markets was starting to heat up. Job hiring companies, often referred to as “recruiters” provide a strong indication of current and future trends in the jobs market.
UK stock reacted as an increase in hiring was seen as a clear indication that the economy is at a turning pointing. Additionally, a number of COVID-19 restrictions are being eased this week, which could give the UK economy a further shot in the arm, as the UK economy returns to a form of normality.
Last week the United Kingdom construction PMI hit its highest level since 2014 last week, which further underscored the bullish shift underway in the UK economy, and also complimented the decade high UK manufacturing PMI which was released just a week earlier.
We should also factor in that the S&P 500, DJIA, and the Nasdaq are entering price discovery and reaching new all-time highs. It is therefore no wonder that the FTSE100 is rallying if we consider the close economic ties that the United Kingdom and the United States share.
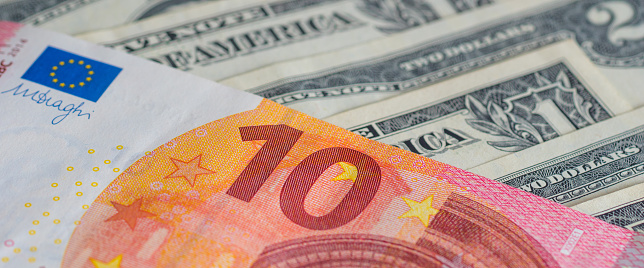
To top it all off, sterling also hit a multi-month low last week. It is worth remembering that the UK100 and sterling often a share an inverse relationship, hence this was another bullish factor underpinning strength in the FTSE100 last week.
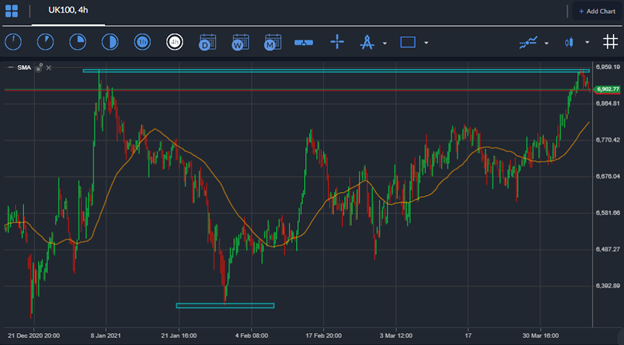
On the technical front, a multi-month low in the ATR indicator last week indicated that a breakout was on the horizon, now it appears that the 7,000-resistance level is merely a formality on the road towards the index’s all-time high.
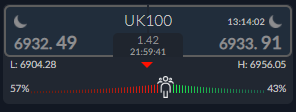
FTSE100 Sentiment Analysis
The Market Sentiment indicator on the ActivTrader platform currently shows that a sentiment shift is starting. 57 percent of traders are bearish towards the index, which is a big change from the start of last week, when 69 percent of traders were bullish towards the FTSE100 right now.


