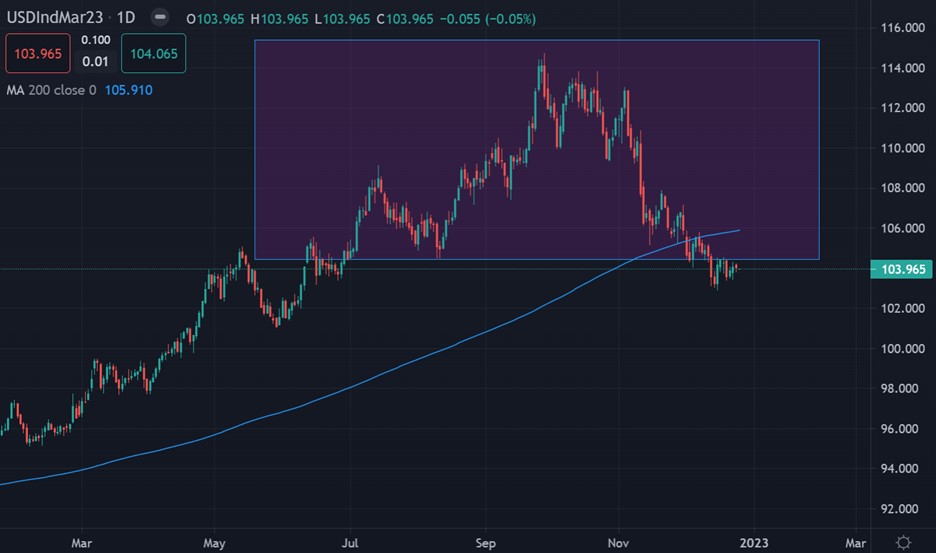
The US dollar index has started to be exhibited signed of breaking out to the downside, as the index breaks under its 200-day moving average and is still heavily bought by retail traders.
The mentioned break under the US dollar index’s 200-day moving average is a significant event from a technical perspective as it now means that the buck is now in a down trend.
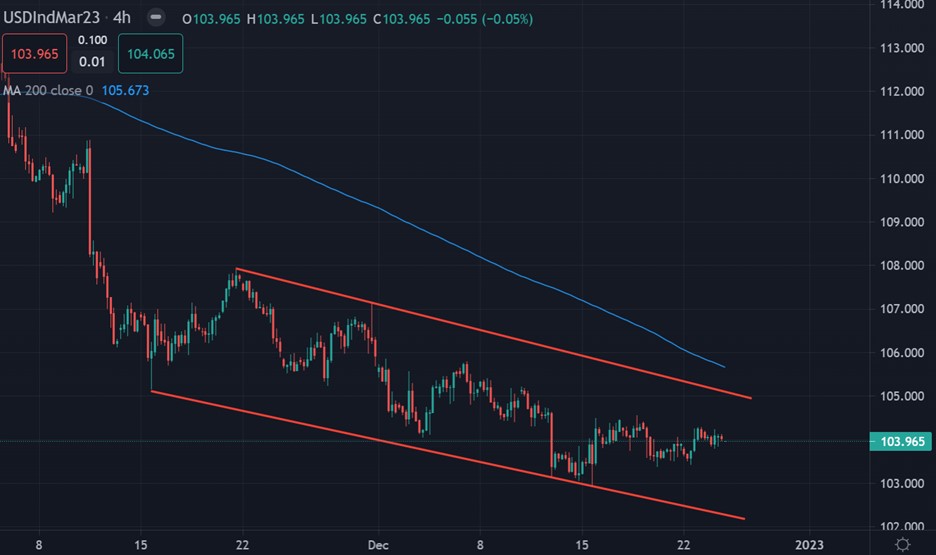
I think more downside is likely ahead until we see a relief rally. I also believe eventually the US dollar index could reach the 102.00 level based upon the short-term technical picture.
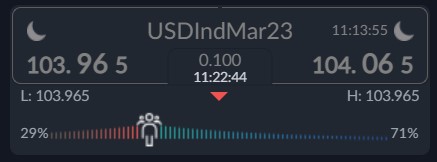
This is also confirmed by sentiment analysis, as it shows that the majority of traders are very long the US dollar index, which likely means more short-term pain ahead.
On the fundamental front I think a move lower in stocks could cause a flight into the greenback, thus it could be we are about to see a lower and then higher scenario.
According to the ActivTrader Market Sentiment tool some 71% of traders are bullish towards the US dollar index, which certainly hints that bulls could be in for more pain this week.
Overall, with retail traders still positive we are probably going to see the US dollar index heading lower. Although the pace of this week’s decline is pretty significant already.
US dollar index Short-Term Technical Analysis
Technical analysis on the four-hour time frame shows that a bullish falling price channel is starting to play out. The price is likely to test the channel bottom which is the immediate downwards price target.
I would be inclined to look for a short-term move towards the 102.00 area. The mentioned time frame is also showing a clear break under the 103.00 support level.
See real-time quotes provided by our partner.
US dollar index Medium-Term Technical Analysis
The daily time frame is showing that US dollar has broken under its 200-day moving average, so far one technical test of the key moving average has failed.
For now, in order for the downtrend in the US dollar index to really stick technically, we probably need to see the 106.00 area defended. A bearish head and shoulders pattern is also seen.
See real-time quotes provided by our partner.