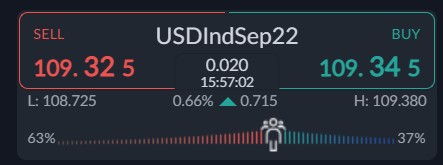
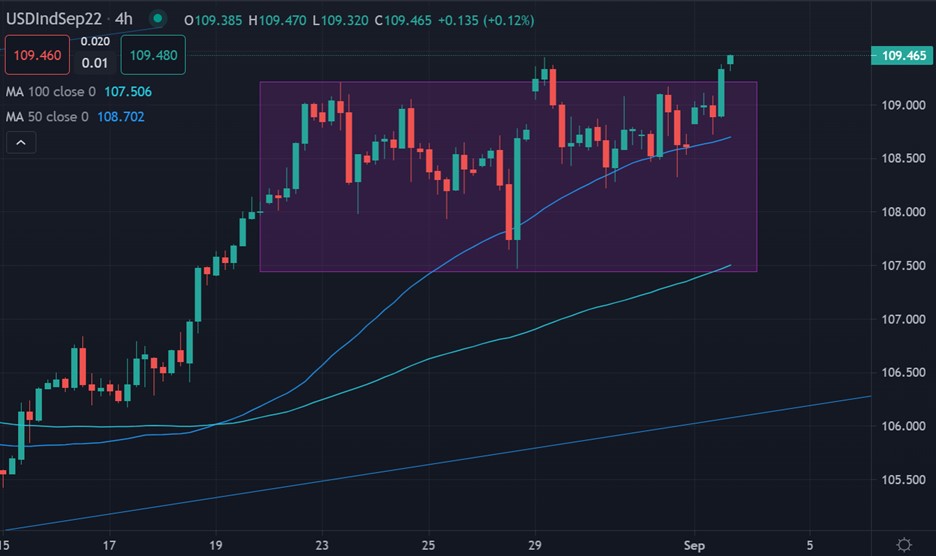
The US dollar index has started to accelerate a new yearly high, with bulls now looking for a break above the 110.00 barrier and launching the index into a new and much higher trading range.
One of the main reasons for the latest breakout in the buck is the fact that the latest US data point have not been that terrible. This means as per the latest statement at Jackson Hole from Chair Powell that aggressive rate action will continue from the US central bank.
Yesterday’s ISM Manufacturing PMI came at 52.8 in August of 2022, the same as in July, and close to 53 in June. Today’s reading beat market forecasts of 52, but still pointed to low levels of factory growth not seen since June 2020.
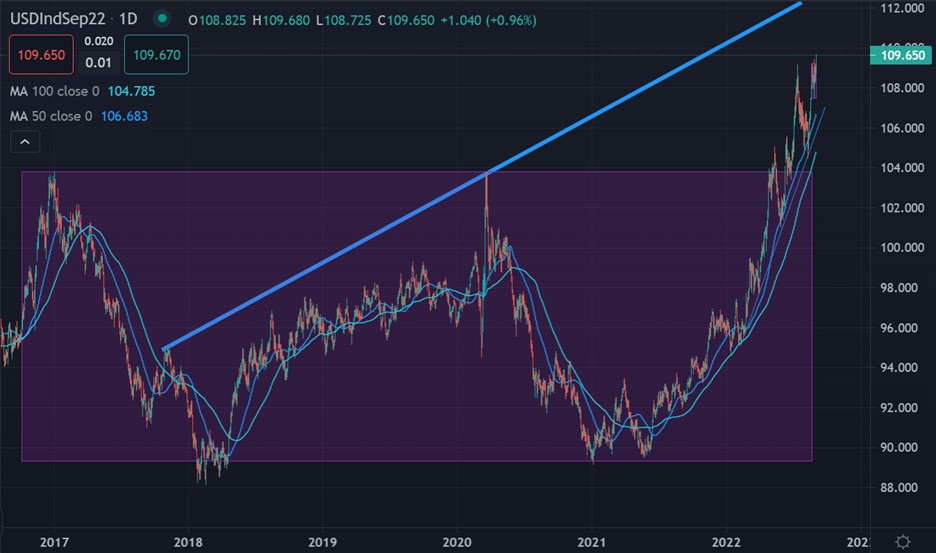
In reaction to the report the US dollar index went to advance to a new 20-year trading high. The US dollar index is holding onto all its weekly gains ahead of the NFP jobs report.
One of the things that has been most shocking is the speed of the move higher in the US dollar index this year. The index could continue to advance to 114.00 according to technical analysis.
Such moves are nearly unheard of in the US dollar index in such a short period of time. This really speaks to not only the demand for greenbacks but also the rise in volatility in the foreign exchange market.
The next shoe to drop to accelerate the move in the buck will probably be the EURUSD pair. Due to the size of the euro in the trade weighting of the DXY, if the EURUSD pair starts to crash then expect the DXY to dramatically accelerate higher.


