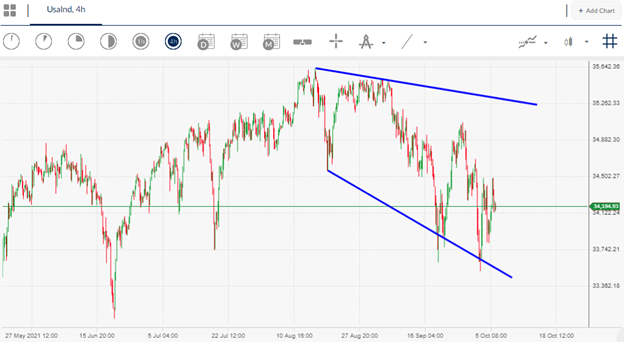
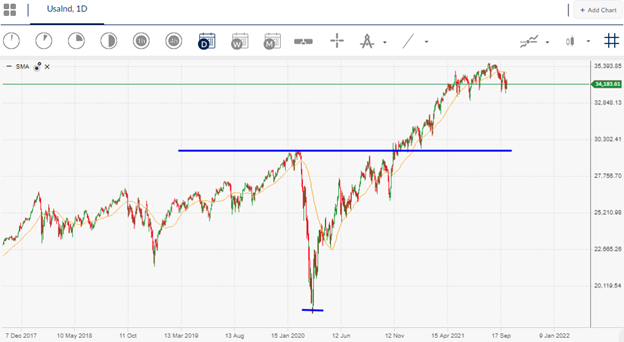
The Dow Jones Industrial Average has been weakening again, as the tape shows few signs of life, however, a bullish reversal pattern is still suggesting a big rebound to the 35,000 level is possible.
Stocks suffered broad based weakness early this week due to China Evergrande’s fears, and the price of oil hit a seven-year high as OPEC and allied oil producers stuck with a plan to cautiously raise production even as global demand for crude oil increases.
Treasury yields has recently been on this rise, which has contributed to weakness in technology stocks. US investors are increasingly worried about inflation as oil prices rise and companies continue facing supply problems that increase their costs and force them to raise prices.
Wall Street is also worried about the Federal Reserve’s timing on trimming back bond purchases and its eventual move to raise its benchmark interest rate. Looking ahead, investors are also preparing for the latest round of corporate earnings.
Ahead of the next FED meeting US economic data is increasingly important as investors look for more signals about the pace of the recovery as businesses and consumers deal with the impact of COVID-19 and the highly contagious delta variant.
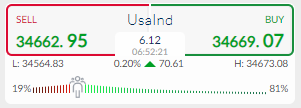
Sentiment towards the index is worryingly bullish at the moment. The ActivTrader Market Sentiment tool shows that some 81 percent of traders are currently bullish towards the DJIA, despite the recent price pullback.
This is significant, as it may suggest further heavy losses are coming for the Dow Jones Industrial Average, as retail traders are often on the wrong side of the market and have poor market timing.


