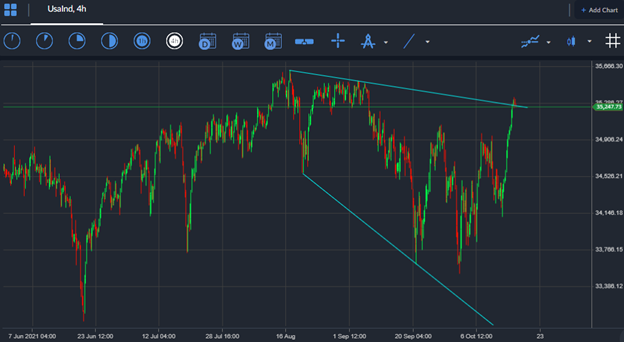
The Dow Jones Industrial Average looks extremely bullish in the short-term after staging a spectacular comeback from just above the 34,100 level, marking a 1,000 point plus recovery from the lows of last week.
Bullish sentiment is broad based across European and US indices, with the likes of the GER40, S&P 500 and the Nasdaq also posting big gains into the middle of the trading month.
This week I think the DJIA could be headed towards the 36,000 level as the index shows few signs of actually retracing. Any moves towards the 35,000 to 34,800 range could be a great dip-buying opportunity.
If the retrace does now come, traders may have to wait until a wider pullback from the 36,000 level takes place. I am very bullish towards the DJIA, and my overall target is around 39,500.
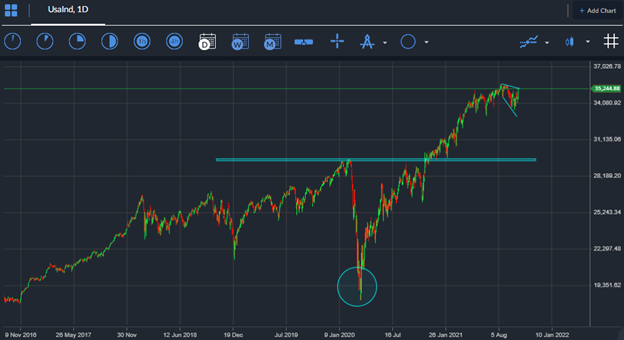
This is due to the presence of a large, inverted head and shoulders pattern on the weekly time frame, plus I think it is still debatable whether the FED will actually taper QE in November considering the current jobs market.
I think US equities are due a rally on the infrastructure bill passing, and also from the lessoning of COVID-19 restrictions, and the fact that no longer will global lockdown will in place going into Christmas.
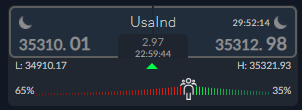
Sentiment towards the Dow Jones Industrial Average index is extremely bearish at the moment. This is a big shift since the 78 percent bullish sentiment bias seen last week.
The ActivTrader Market Sentiment tool shows that some 65 percent of traders are currently bearish towards the DJIA. I feel more losses are possible since retail traders are often on the wrong side of the market and have poor market timing.


