Weekly Index Analysis
See real-time quotes provided by our partner.
It is still earnings season across the US and we’re also now into a traditionally low performance period due to seasonality. July has been a great month for the S&P500 since the lows of the GFC in 2009. Whereas August has not been so good, with 7 of the last 12 being negative months.
Q2 year over year earnings in 2021 are expected to be up 89.8%. Of the 296 companies in the S&P 500 that have reported earnings to date for 21Q2, 88.5% have reported earnings above analyst estimates. With good earnings should come better stock prices. However, the markets are future looking, and the narrative currently is that companies are doing well, though there is an issue with supply chains, bottlenecks, not enough employees, and the Coronavirus variants, which are all going to make it harder to do business the longer this carries on.
The amount of money that has flowed into the stock markets from the US Treasury is massive and around the corner a further $500bln of new money is being proposed in the $1trln Infrastructure Bill. This fiscal spending is also going to help the stock market’s overall as the US economy grows. What we need to keep an eye on is how much the new US Administration takes out of the economy through new taxation or cancelling of fiscal programmes. If what they take out doesn’t amount to more than they are looking to spend, I see the S&P500 etc. rising further.
See real-time quotes provided by our partner.
The rise higher in July has now come to a rather abrupt end as we await more employment data this week. We heard from Fed Chair Powell and the FOMC who are waiting for significant progress to be made in the employment and inflation data before they act.
Todays United States private sector employment data rose by 330,000 in July compared to the previous month, which was a massive miss compared to analysts’ predictions of 695,000 new jobs. If this number means the Non-Farm Payrolls out on Friday are weaker the chances of the Fed amending policy will be moderated.


The largest number of new jobs were added in the service-providing sector, where a total of 318,000 new jobs were reported. Within the sector, leisure and hospitality led the gains with an increase of 139,000 positions and was the fastest growing industry for the fifth consecutive month.
Commenting on the economy today Federal Reserve Vice Chairman Richard Clarida said the central bank is likely to hit its economic targets by the end of next year and start raising interest rates again in 2023.
See real-time quotes provided by our partner.
When the market is slow or waiting for a key piece of data I tend to follow the first hour of trading in the US session, which is known as the Initial Balance. If you draw a box around the candles that form in this period, you have a range where most of the trading volume is done for the day. You also have a gauge to whether the new day is above, below or within the previous days range. From the chart above it is easy to see that the market is trending sideways and that a floor is being made for the Nasdaq around 14,800 with a ceiling around 15,100. Until price escapes beyond either of those levels the chances are the trading will be range bound, which is great for mean reversion strategies but terrible for breakouts and trend following strategies. Understanding the current conditions is key.
See real-time quotes provided by our partner.
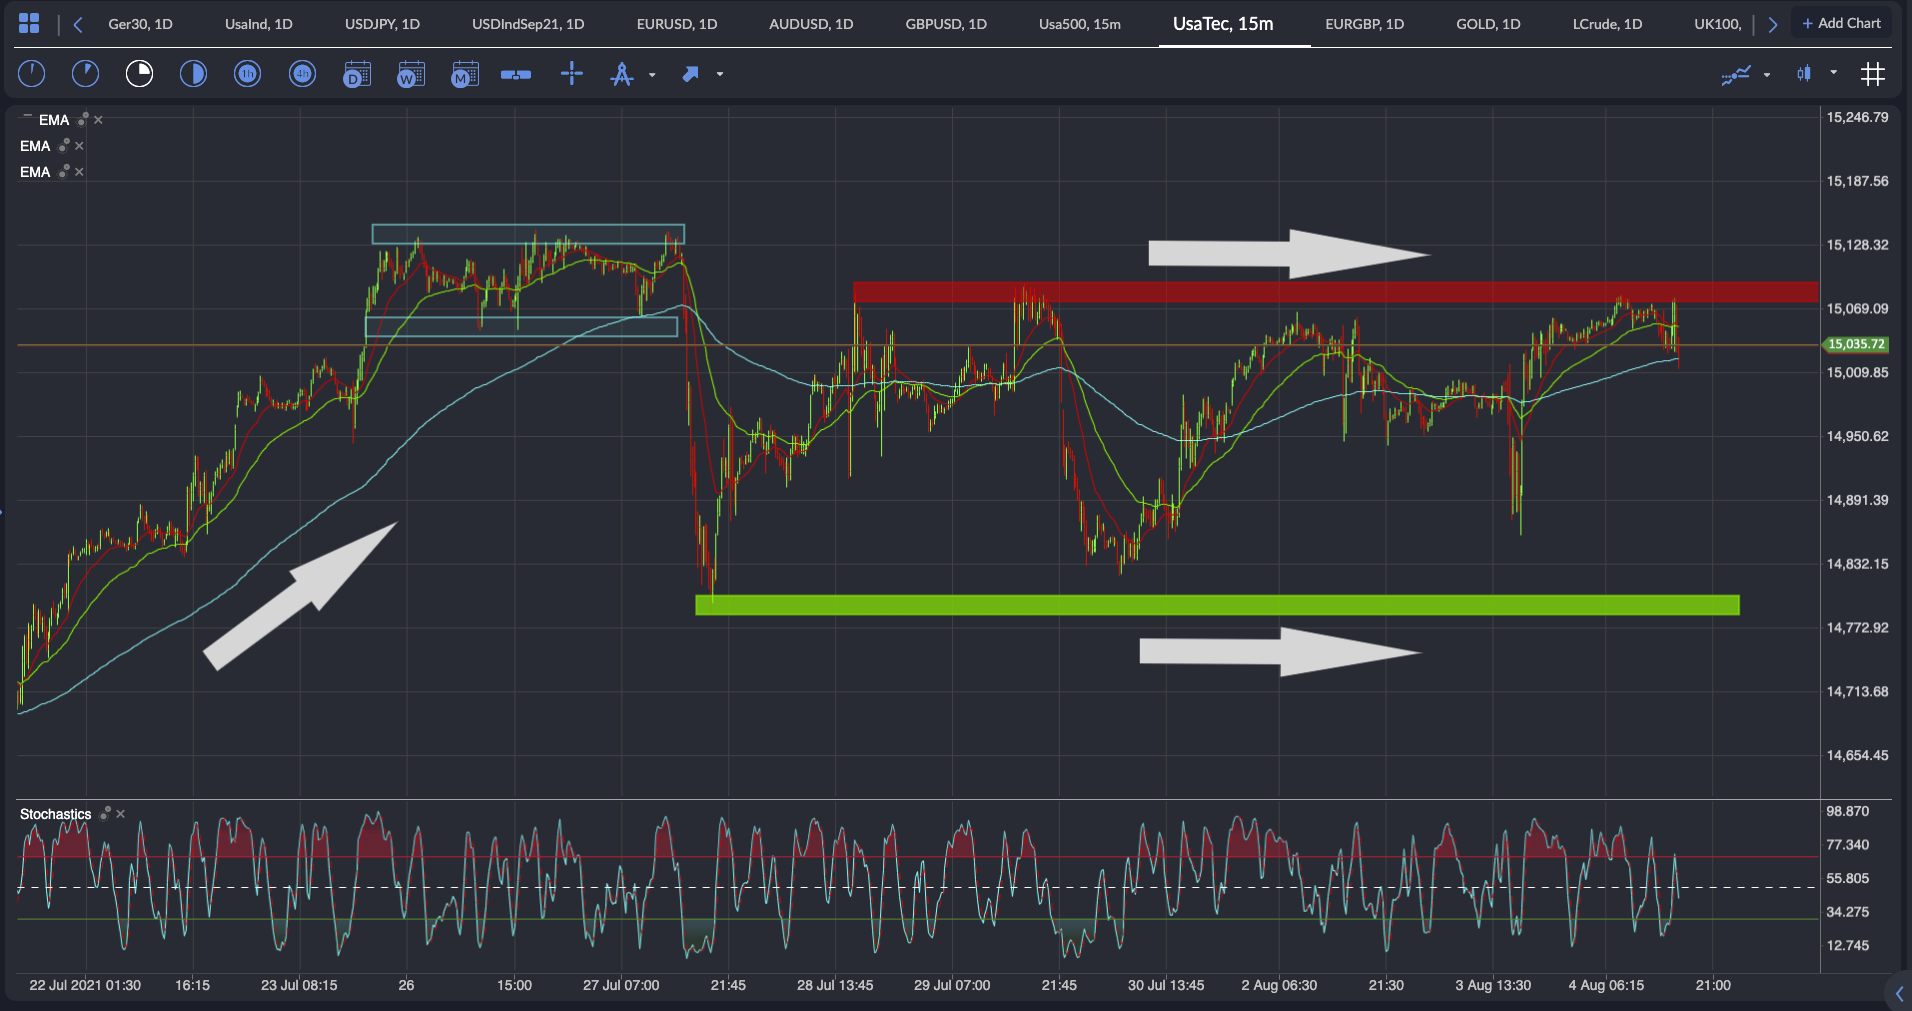
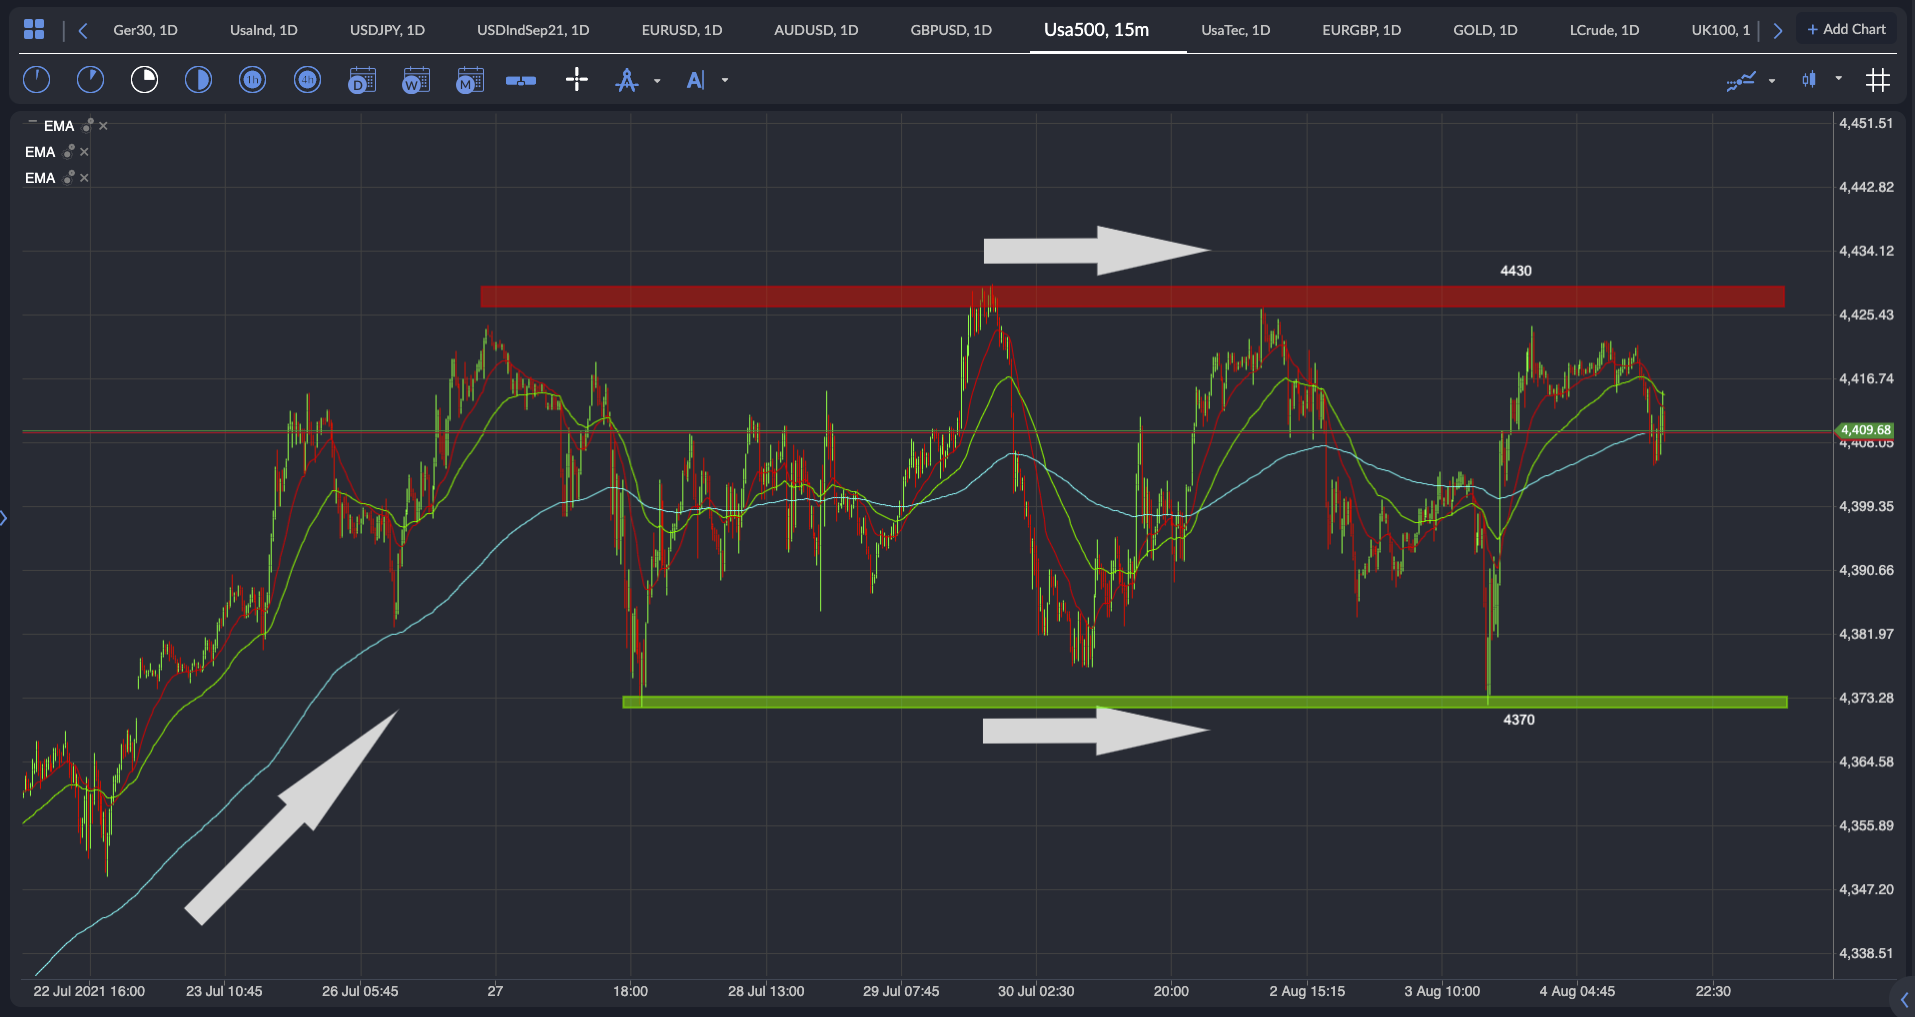
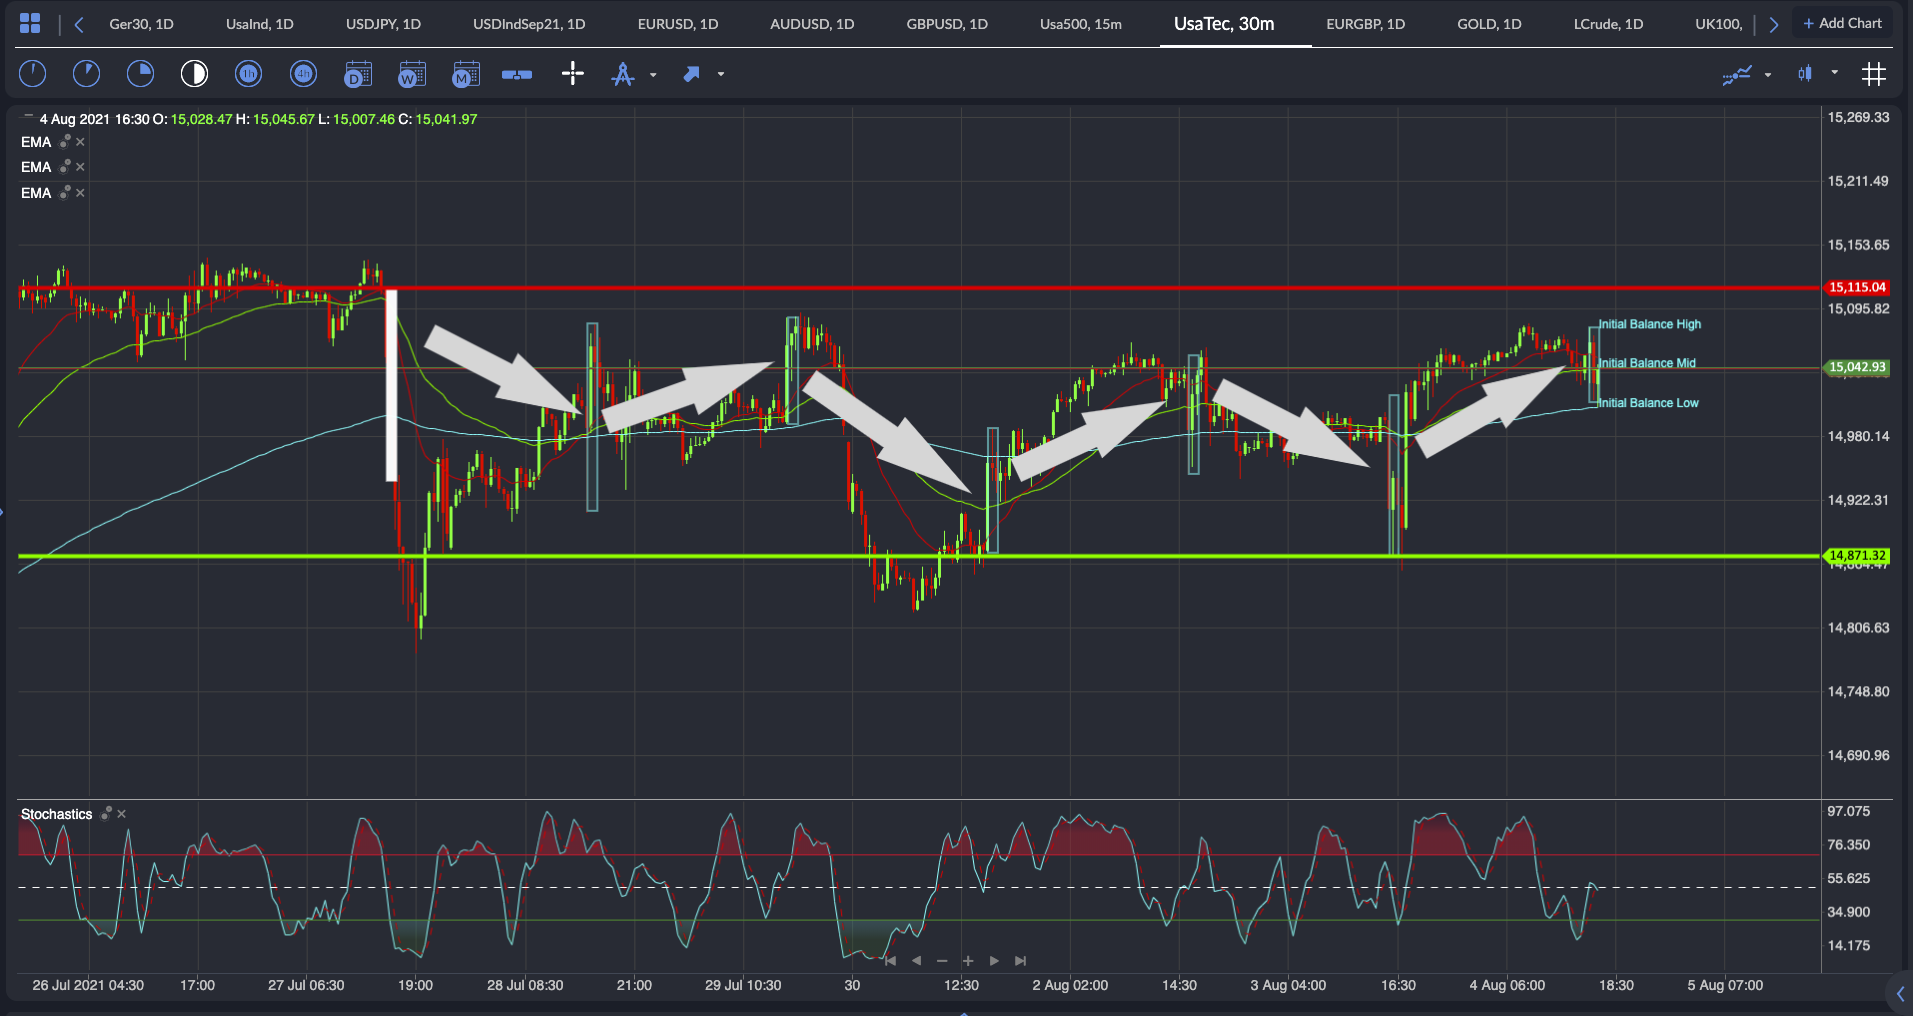
The question is how you know when the markets have switched from being momentum driven and trending to mean reverting and ranging?
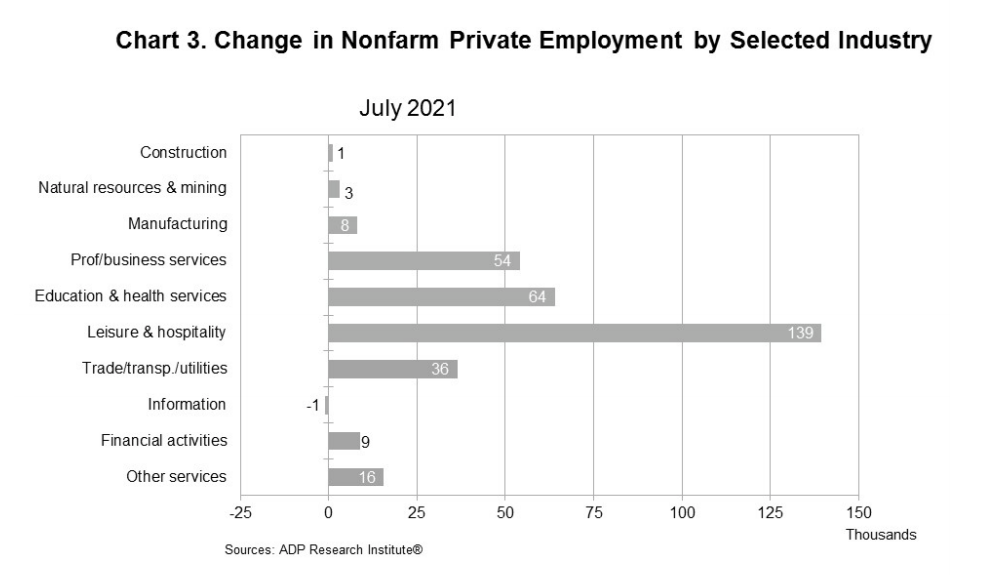
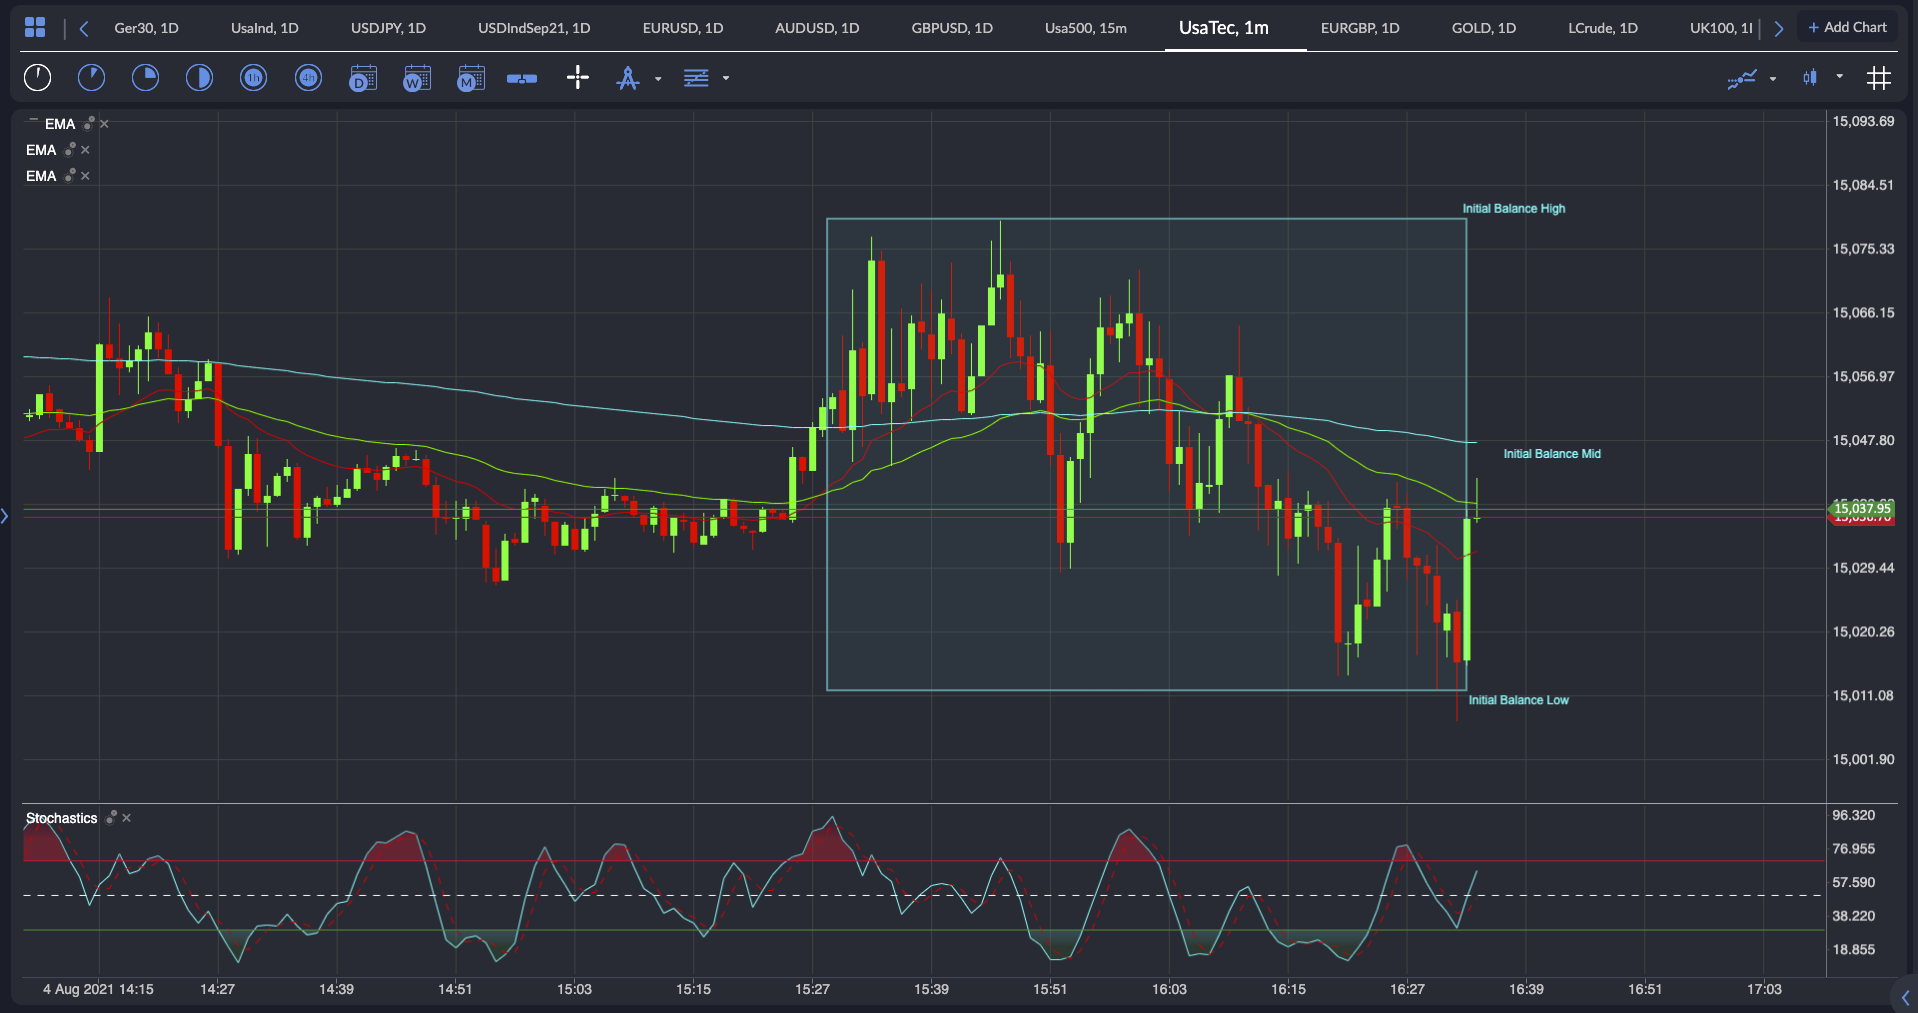
The best way that I have found is to use the Initial Balance as my guide and see where it is with regards to the previous day. Today’s IB formed after the ADP figure and the US Markit/ISM PMI data. It also encompasses Fed Clarida’s speech which means there is little more news today that may affect the Nasdaq or S&P500, so with that in mind, if we haven’t been able to breakout of the IB with all that data, there is little probability that today is a trending day.
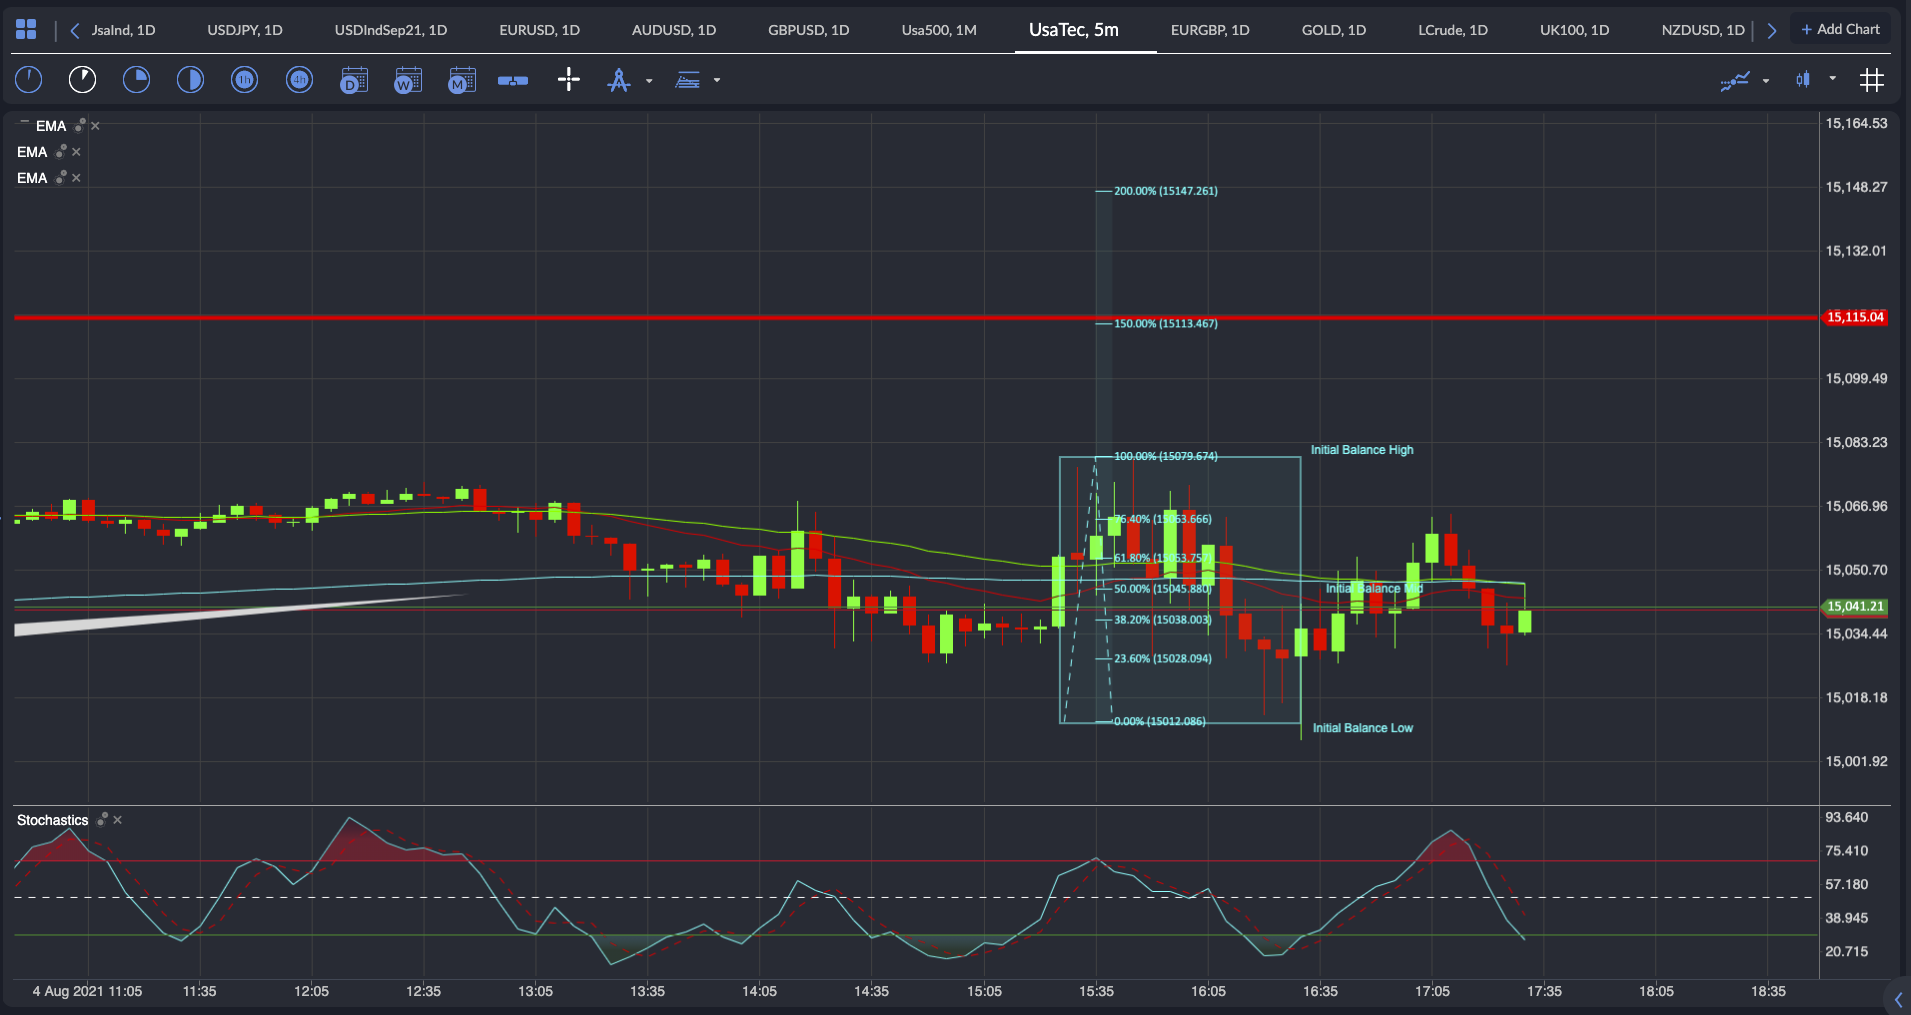
To further help you decide on whether to buy a breakout or sell a breakdown of the IB rather than fade it back to the midline, plenty of traders and investors have done statistical analysis on the probabilities of a trending move following on from a breakout of the IB.
As an example, over a period of 2,823 trading days, 95.36% of the time the IB High or IB Low was broken during the regular trading hours (RTH). The RTH is the US session. There was a 60% of the breakout reaching 50% of the IB range above or below the breakout line, within the days RTH. With 30% of those breakouts making a measured move higher or lower during the RTH.
If you were to conduct your own analysis on the last years’ worth of trading, you may find that these stats still remain relevant, and I certainly used the notion that if I were to trade the breakout that I aimed for at least 50% of the IB range and didn’t put too much expectancy on getting a measured move.
See real-time quotes provided by our partner.
Using today on the Nasdaq as an example, the trend over the last few months has been for the Nasdaq to trade higher. I have already described the current action as being sideways, so any breakouts to the upside are most likely to get faded back to the mean. Today’s price movements since the IB completed have been within the IB range and the mid-point is currently acting as a magnet. If for some reason the algos decide to push price higher and I was inclined to trade the breakout above the 15,080 level, my initial and probably only target today would be the 50% range extension up to 15,110 with my eye on the full extension should we accelerate through the larger range high that we have formed these last 7 trading days.
With the August seasonality coming into play and the understanding that the market is focused on the NFP data this week, I personally will not be trading the Nasdaq or S&P500 until we have either received the data and seen a decisive move from the traders or we make our way out of this large trading range. I am also expecting the worst for these indices and that could come on Friday if the NFP disappoints as per the ADP data today.