The price of copper is starting to turn lower in early-week trade due more COVID-19 outbreaks in China and weaker than expected PMI data from the world’s second largest economy.
A contraction in nom-manufacturing and manufacturing data from the Chinese economy underscored the economic trouble that China is undergoing and why copper demand may be weakening.
It is also noteworthy that China announces major factories closing and a shutdown of Macau Casino resort and Disney resort. Both closures will of course hurt the economy.
Copper is usually considered a proxy for global growth. When copper demand is weak it normally means that the Chinese economy is starting to weaken or is experiencing growth problems.
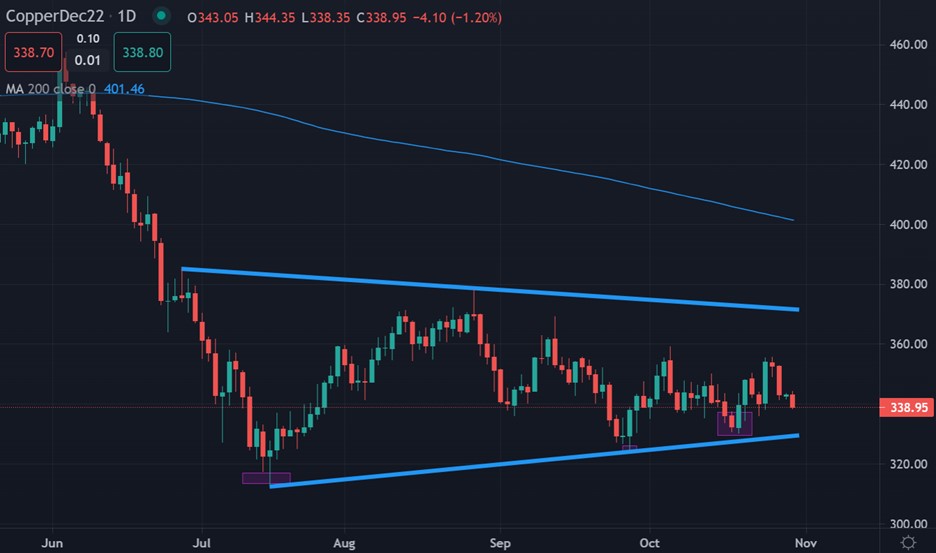
Copper remains below its key 200-week moving average, so the trend is still bearish. Obviously, traders look to the 200-week moving average for confirmation of the long-term trend.
I would argue that if the price of copper continues to trade under its 200-week moving average it is probably not the time to consider buying copper. Although further confirmation is certainly needed technically and fundamentally.
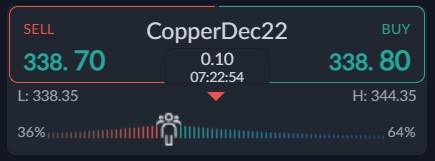
Sentiment towards copper has been the biggest risk in the market over recent months as the market turned heavily bullish towards the red metal. According to the ActivTrader platform some 64 percent of traders are bullish towards Copper. With the current bearish sentiment bias towards copper, I believe more short-term downside in the red metal seems the most likely scenario.


