The price of copper is starting to recover after moving close to the $310.00 support level earlier this month. The move higher so far looks to be technical rather than based upon any fundamentals.
Copper bulls could be in luck as the technical landscape is pointing to a rebound in the not-too-distant future if bulls can hold the price above the $300.00 level over the coming weeks.
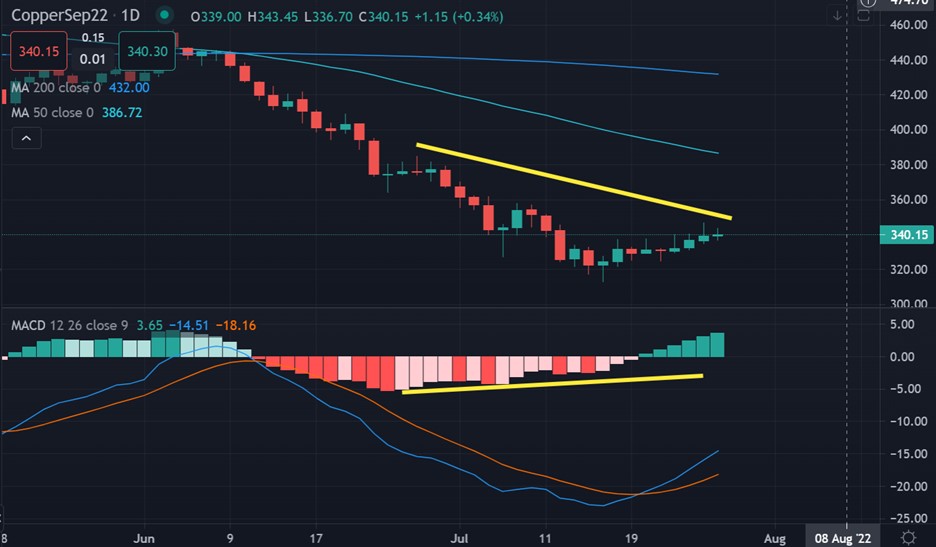
Higher time frame analysis shows a substantial amount of bullish MACD price divergence on the charts. However, higher time frame price divergence can take a long time to unwind.
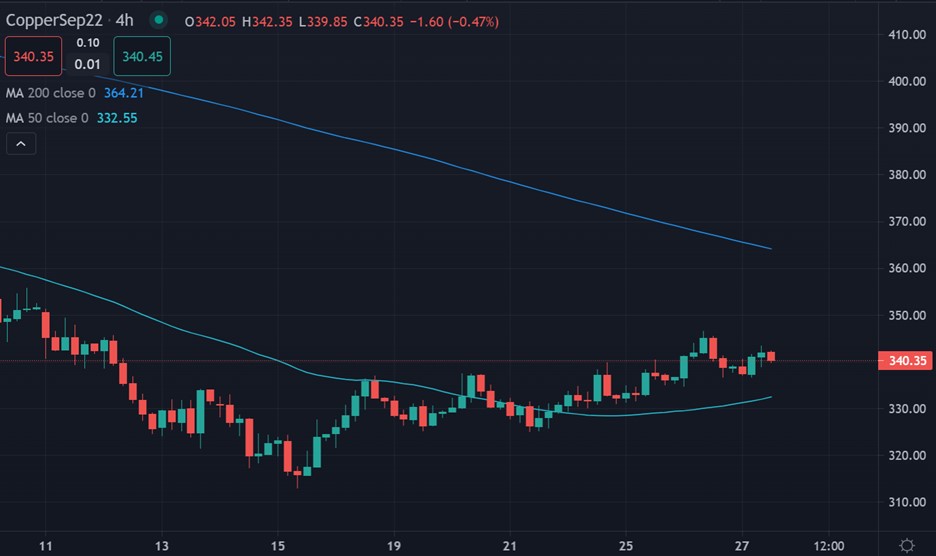
Lower time frame analysis does show that the short-term case for more upside is strong due to the presence of a potential Wyckoff price pattern. Wyckoff patterns can be very bullish and also explosive.
In order for the Wyckoff pattern to be confirmed we probably need to see a move through the $350.00 level. This should cause an explosive move towards the $360.00 to $370.00 area.
Sentiment towards copper has been the biggest risk in the market over recent months as the market turned heavily bullish towards the red metal. Sadly, the herd is thinking that more gains are indeed possible.
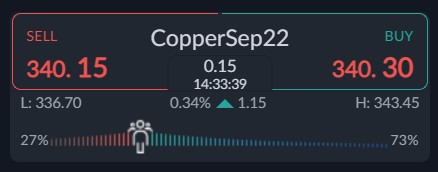
According to the ActivTrader platform some 73 percent of traders are bullish towards Copper. With the current bullish sentiment bias towards copper, I believe more short-term downside in the red metal seems the most likely scenario.


