Weekly Investment Idea
After Fridays CPI print, the odds of a higher rate hike by 75bps have risen. Amazon stock remains under pressure from an increase in interest rates as recession fears peak. The US 10-year treasury yield rallied by +3.68% on Friday as investors are attracted to interest-paying assets in the near term. A breach above the near-term resistance at 3.26% in the benchmark yield, may see a further dip in the Amazon stock and its peers. Investors are now positioning ahead, for the Fed policy meeting minutes on the 15th of June.
The previous earnings and revenue report released by Amazon in April (Q1) indicated a major decline as the Chinese lockdown affected demand. The earnings report fell from an expected 0.42% to -0.38%, making a surprise drop of 190.53%. Revenue declined from an expected $116.45 Billion to $116.45 Billion, leaving a -$6.273 million loss for the company.
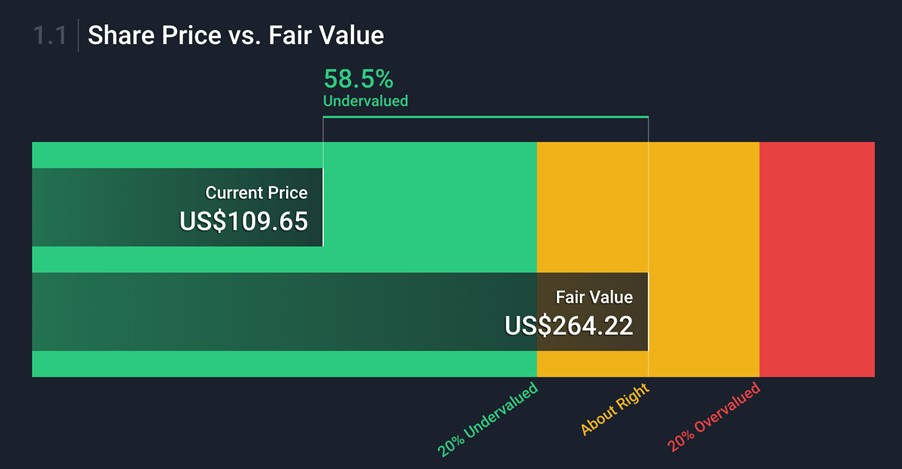
Overall, Amazon’s stock remains attractive in the short term. On June 6, Amazon had a stock split where shareholders got 20 shares for each stock they owned; the market price for each share is now 1/20 of the pre-split price. Some analysts have highlighted that the stock is undervalued compared to the market. The company’s last stock split was in September 1999, when it approved a 2:1 split. Historically stock splits were followed by a rally as it attracts retail buyers to participate in the lower prices for the stock. With projections pointing towards 264.22 for just hitting fair value, there is a potential for a major repricing higher once the cost of energy comes lower.
The Q2 earnings and revenue report due for release on the 28th of July is expected to be better than previous figures. Earnings are estimated to grow to 0.16 from -0.38 while revenue is estimated at $119.748 billion from the previous $116.45. The sentiment around positive earnings and revenue reports could help lift the stock price in the near term.
See real-time quotes provided by our partner.
Amazon Inc. trimmed gains towards the 101.00, yearly support as bulls lost steam at the 129.00 near-term high. A William’s Alligator indicator is used as a dynamic support and resistance indicator, and it suggests that on the weekly chart the stock is currently capped by a bearish outlook unless the price breaks the 133.00 near-term barrier. A break below the 101.00 support may reinforce the bearish sentiment and the next critical level to watch out for is the 81.55 support.
However, a break above the 133.00 may open room for further upside gains toward the 168.00 high. A defence of 101.00 by bulls will be necessary to build towards a rally to the upside. The MACD indicator suggests diminishing bearish interests as volume bars shrink towards the baseline. A break above that neutral level is necessary to change the bearish sentiment to bullish in the near term.
See real-time quotes provided by our partner.
The Daily chart shows potential for the Amazon stock to trade higher if bulls manage to hold above the 101.00. The chart has a price action gap between 130.00 and 135.00 which was created on the 29th of April 2022, which led to the eventual breach of the 135.00 support level. Price action gaps tend to fill up in the near term before a significant trend. A break above the 135.00 level, previous support turned resistance may cause a bull rally towards the 168.00 level.
If the stock fails to break above that critical pivot at 135.00 the signal may cause selling pressure on the stock in the near term. Upside gains are capped by a 50-day moving average (green) at 130.00 and a 200-day moving average trading at 140.00 (yellow).