Youtrading UK
Português Español русский
Register Login
  • Markets
  • Charts
  • Economic Calendar
  • World
  • Economy
  • Insights
  • About Us
No Result
View All Result
Youtrading UK
  • Markets
  • Charts
  • Economic Calendar
  • World
  • Economy
  • Insights
  • About Us
No Result
View All Result
Youtrading UK
No Result
View All Result

Technical Analysis Traders Buy The Nasdaq Dips

by Neville Hornsey
7 July 2021
in Index
0
Nasdaq traders wait for Risk-On to continue
270
SHARES
8.9k
VIEWS
Share on FacebookShare on TwitterShare on WhatsApp

Weekly Indices Analysis

Over the last 3 months the Dow Jones Industrial Average, Nasdaq 100 and S&P500 are up 3.37%, 9.01% and 6.51% respectively. Over the last year the 3 indices are up 33.53%, 41.04% and 38.30% and look to fresh highs each passing week. Towards the end of June, the DJIA looked like it was trying to break lower but has for the last 3 weeks made a new high without testing the previous weeks lows.

On my charts I always try and keep a set of trend and momentum indicators for visual support and resistance. The 3 exponential moving averages are always the 20, 50 and 200 period as these are widely monitored across all levels of trading. The stochastic offers a cheat sheet on when a pullback is more likely to be over, or when the rip is losing some momentum, but the market structure and size of candles can also as easily hint at where the support and resistance may lay.

Multi time frame analysis is also a key element to my trading, and I find using the same indicators but across different time frames helps me quickly gauge the strength and direction of the current market. For example, if I were looking to take an intraday trade, I would want to enter on a small-time frame like the 5-minute chart, but I would only wish to trade with the momentum and direction of the hourly time frame. And for added reason to place some size, I would want these shorter time frames to be in line with the momentum and direction of the daily chart.

Using the current Nasdaq Daily, Hourly and 5-minute charts, we can see that prices have made a new all-time high today at the US session open and cleared the previous day’s highs during the London session. The 20 (red), 50 (green) and 200 (blue) period ema’s are stacked on top of one another, they are diverging and are all pointing higher, which to me indicates that the market is in a prolonged move to the upside.

See real-time quotes provided by our partner.

The stochastic (10,3,3) indicator is overbought and has been for the entire move higher from when the candles closed above the moving averages back in May 2021. If the daily stochastic indicator were to now travel lower and close below the 70 level, that would be a clear indication that the market structure had shifted out of the grinding higher mode.

See real-time quotes provided by our partner.

A rising trend where the daily candles make new highs and new higher lows is a great starting point to looking for a long bias on the hourly charts. Just after the US session opened the Nasdaq pulled back lower and touched the rising 20 period moving average on the h1 chart. This ema, acted as dynamic support as did the confluent 14,800 level, which had been significant resistance from the close last night. Traders will be targeting big round numbers and the next one is the 15,000, so only 200 points to go. Buying the dip gives these traders something to repeat each time they get a mini sell off like we saw within the first hour of the US session today.

See real-time quotes provided by our partner.

On the lowest time frame and the one that I use as a trigger, the price action seen on the hourly chart correlated in the m5 price action finding support at the 200 period ema. For anyone trading the London session the dips down to the 50-period moving average, had proved a great strategy when the stochastic (10,3,3) had confirmed an oversold reading. But now we have extra volatility brought on by the added volume as the US traders entered the markets. The extra volume and volatility expand the ranges, so targets to the upside and lower increase and the envelopes of what was a standard deviation increase to 2 deviations or more.

See real-time quotes provided by our partner.

The same m5 chart a few moments later shows how the market used the 14,800/200 period ema as support. The oversold stochastic highlighted the move to the downside could be coming to an end. And the result is a 50 point move back to the upside and into the London session balance period before the US session expanded the range to the upside.

Could this go higher today? We would need to get above the balance area for me to take a further long or add to the position from the 14,800 bounces. However, the probabilities of this going higher is still in our favour.

Rising interest rates are not kind to tech stocks. Rising rate volatility is not kind for tech stocks. And rising inflation is not kind to tech stocks. Currently rates set by the US Federal Reserve are low and the latest reading is 0.08.

The current yields in the US treasuries are also low or rolling over from their peak in March 2021.

Tech shares like Uber, Tesla, NVIDIA, Amazon, Netflix, Facebook are particularly sensitive to changes in interest rates. If you are new Tech IPO company with no real earnings data either current or going into the next few years, your company is going to be even more sensitive to rising yields and interest rates. Valuations for technology stocks are heavily predicated on long-term interest rates remaining low and when we had the rising inflation fears and market anticipation for the Fed to raise early, the Nasdaq took a near 2000-point hit. It lasted for a couple of months between February and March and now on a monthly chart the current price action looks like expanding that range by at least 2X.

See real-time quotes provided by our partner.

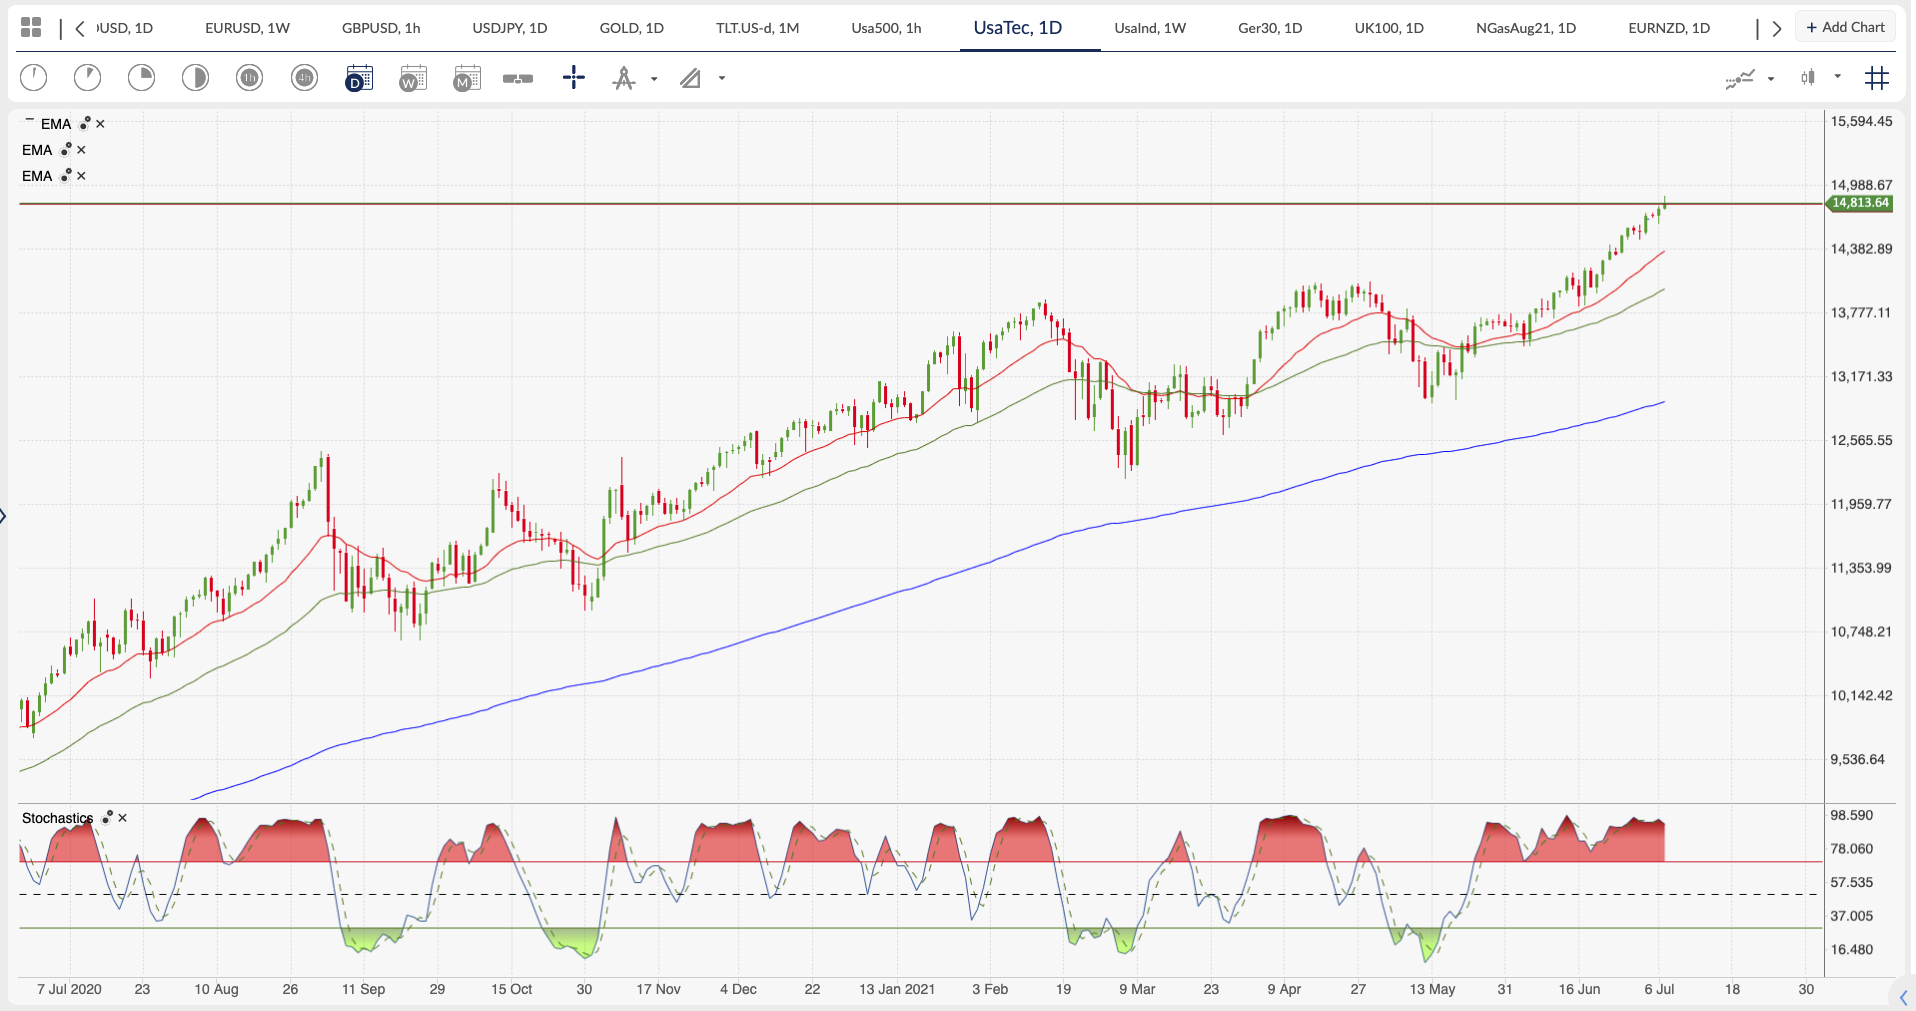
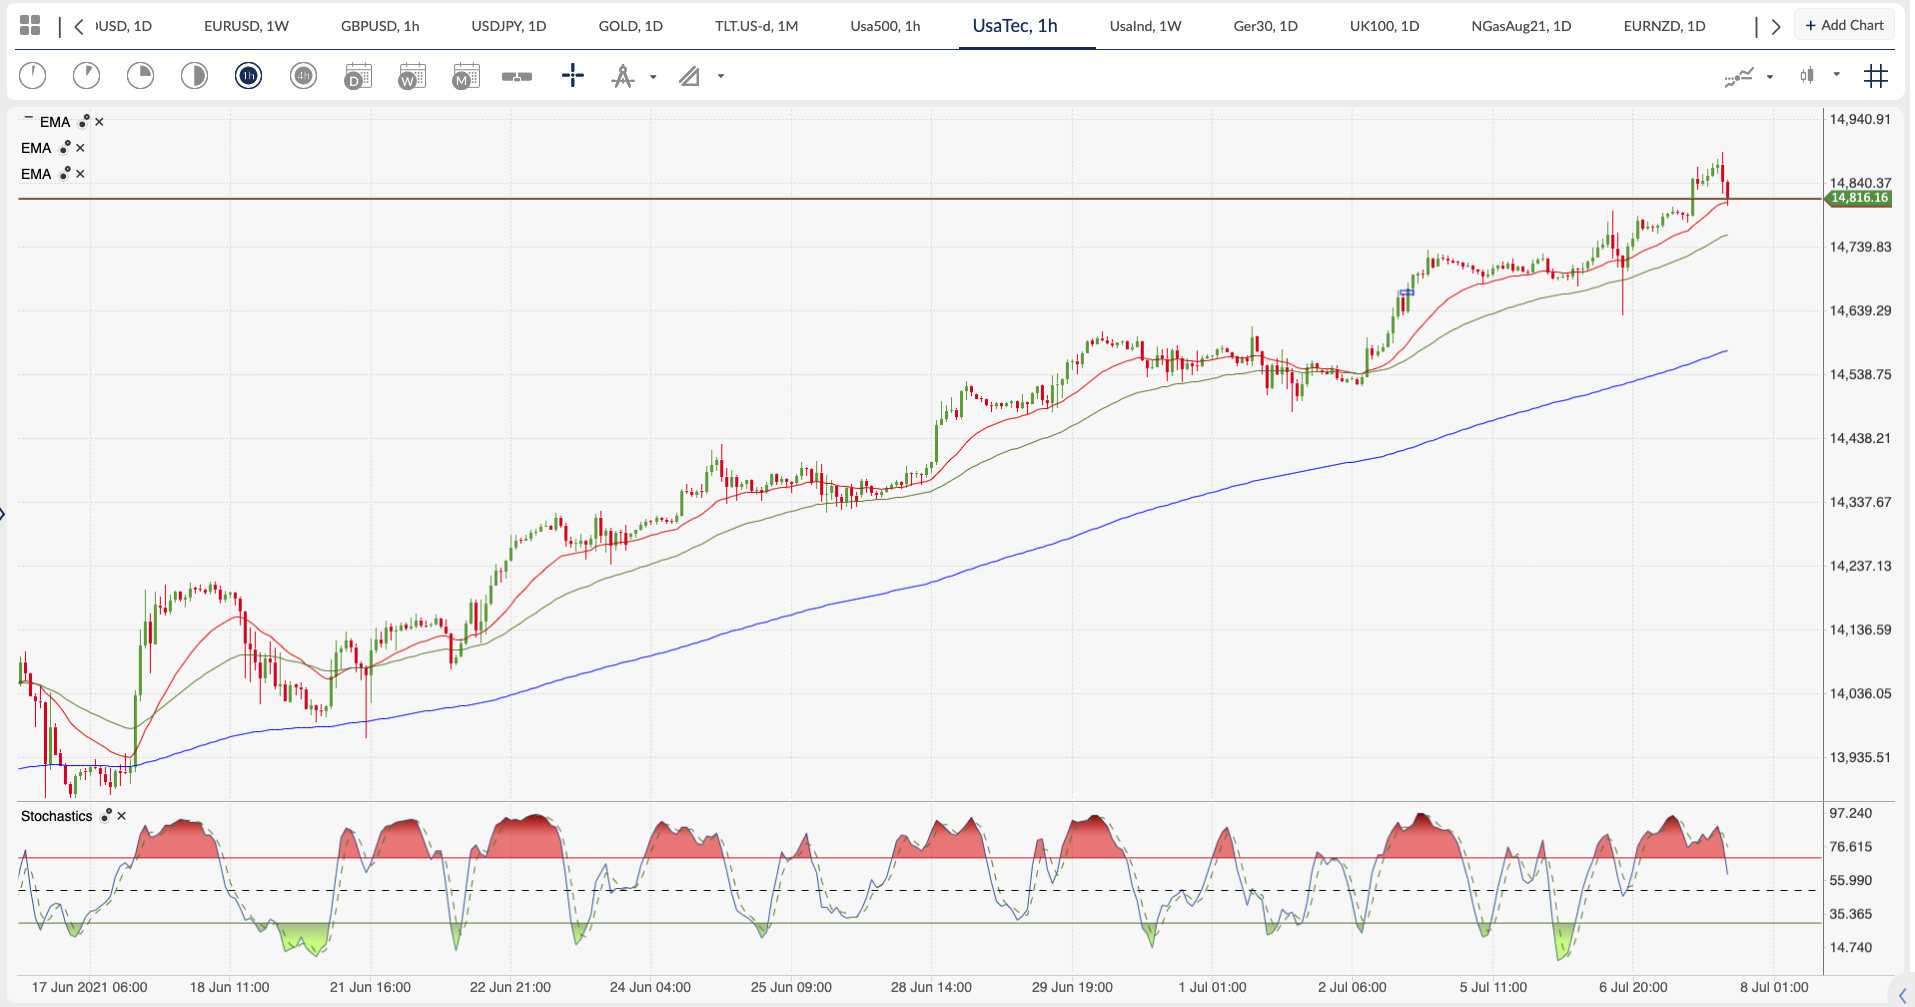
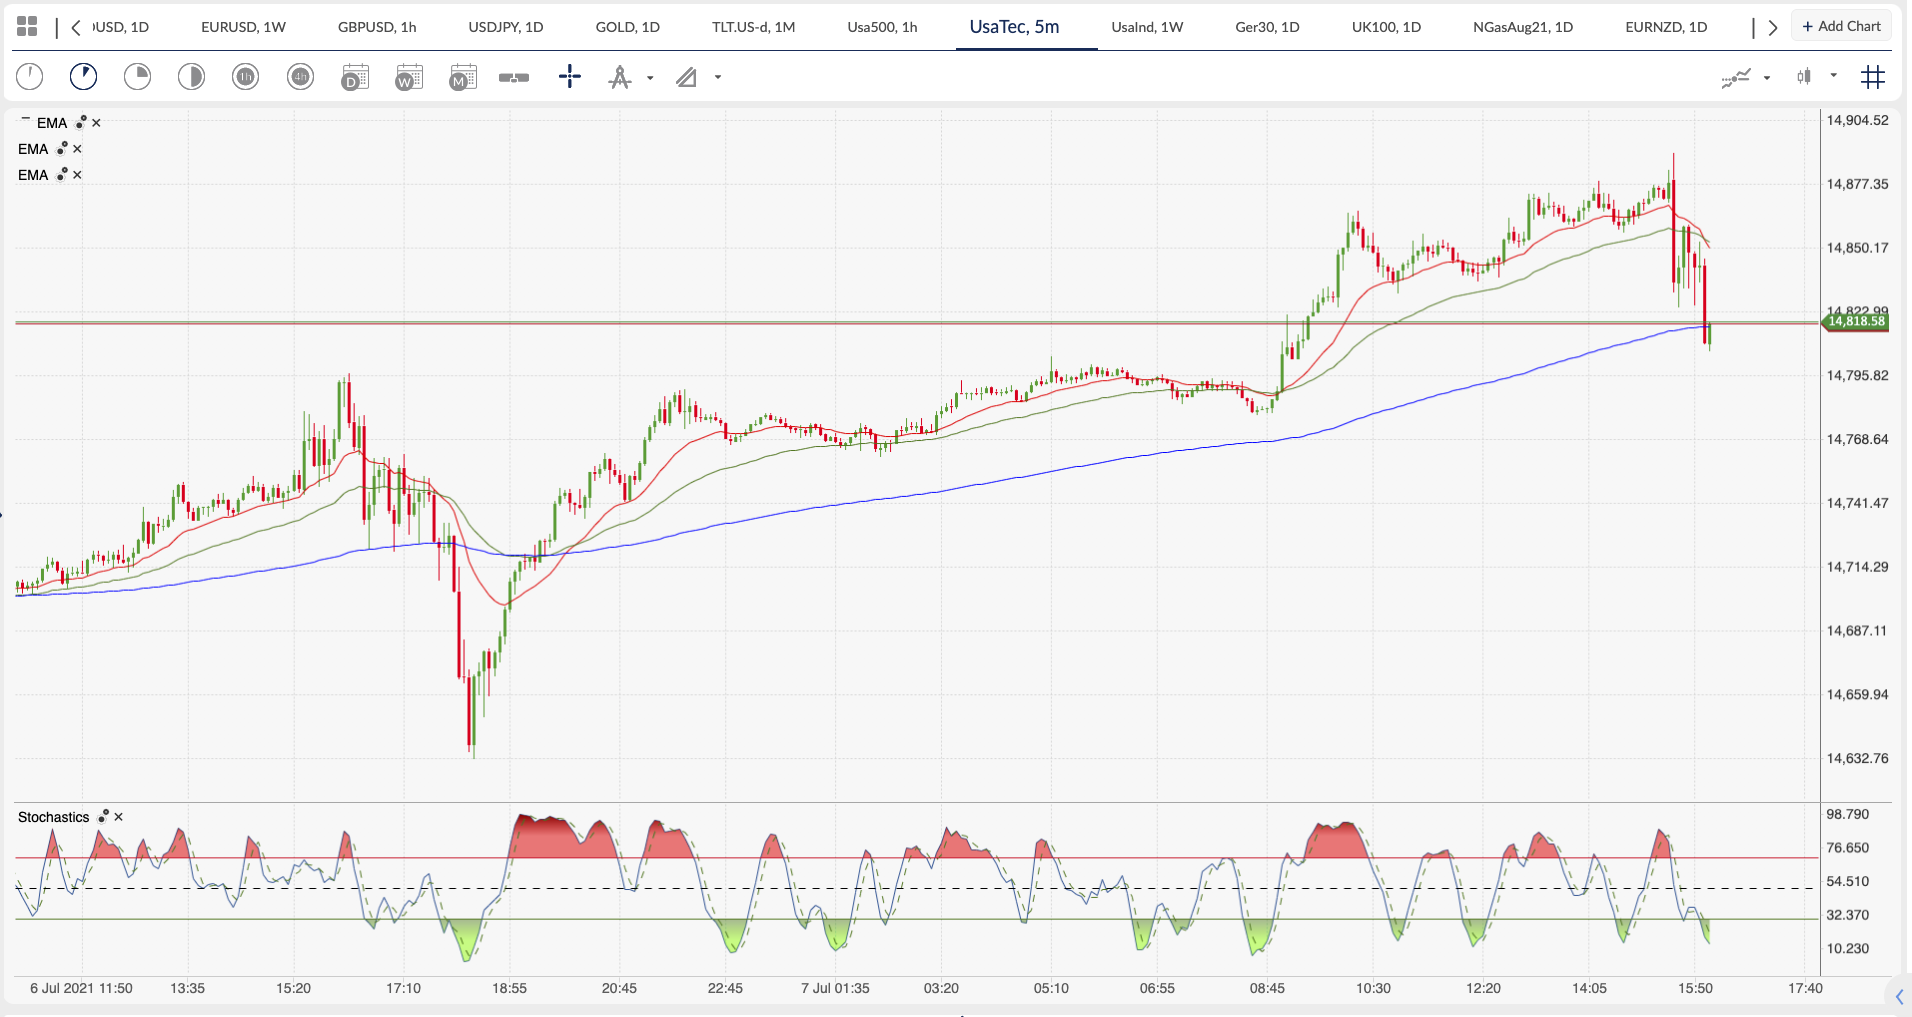
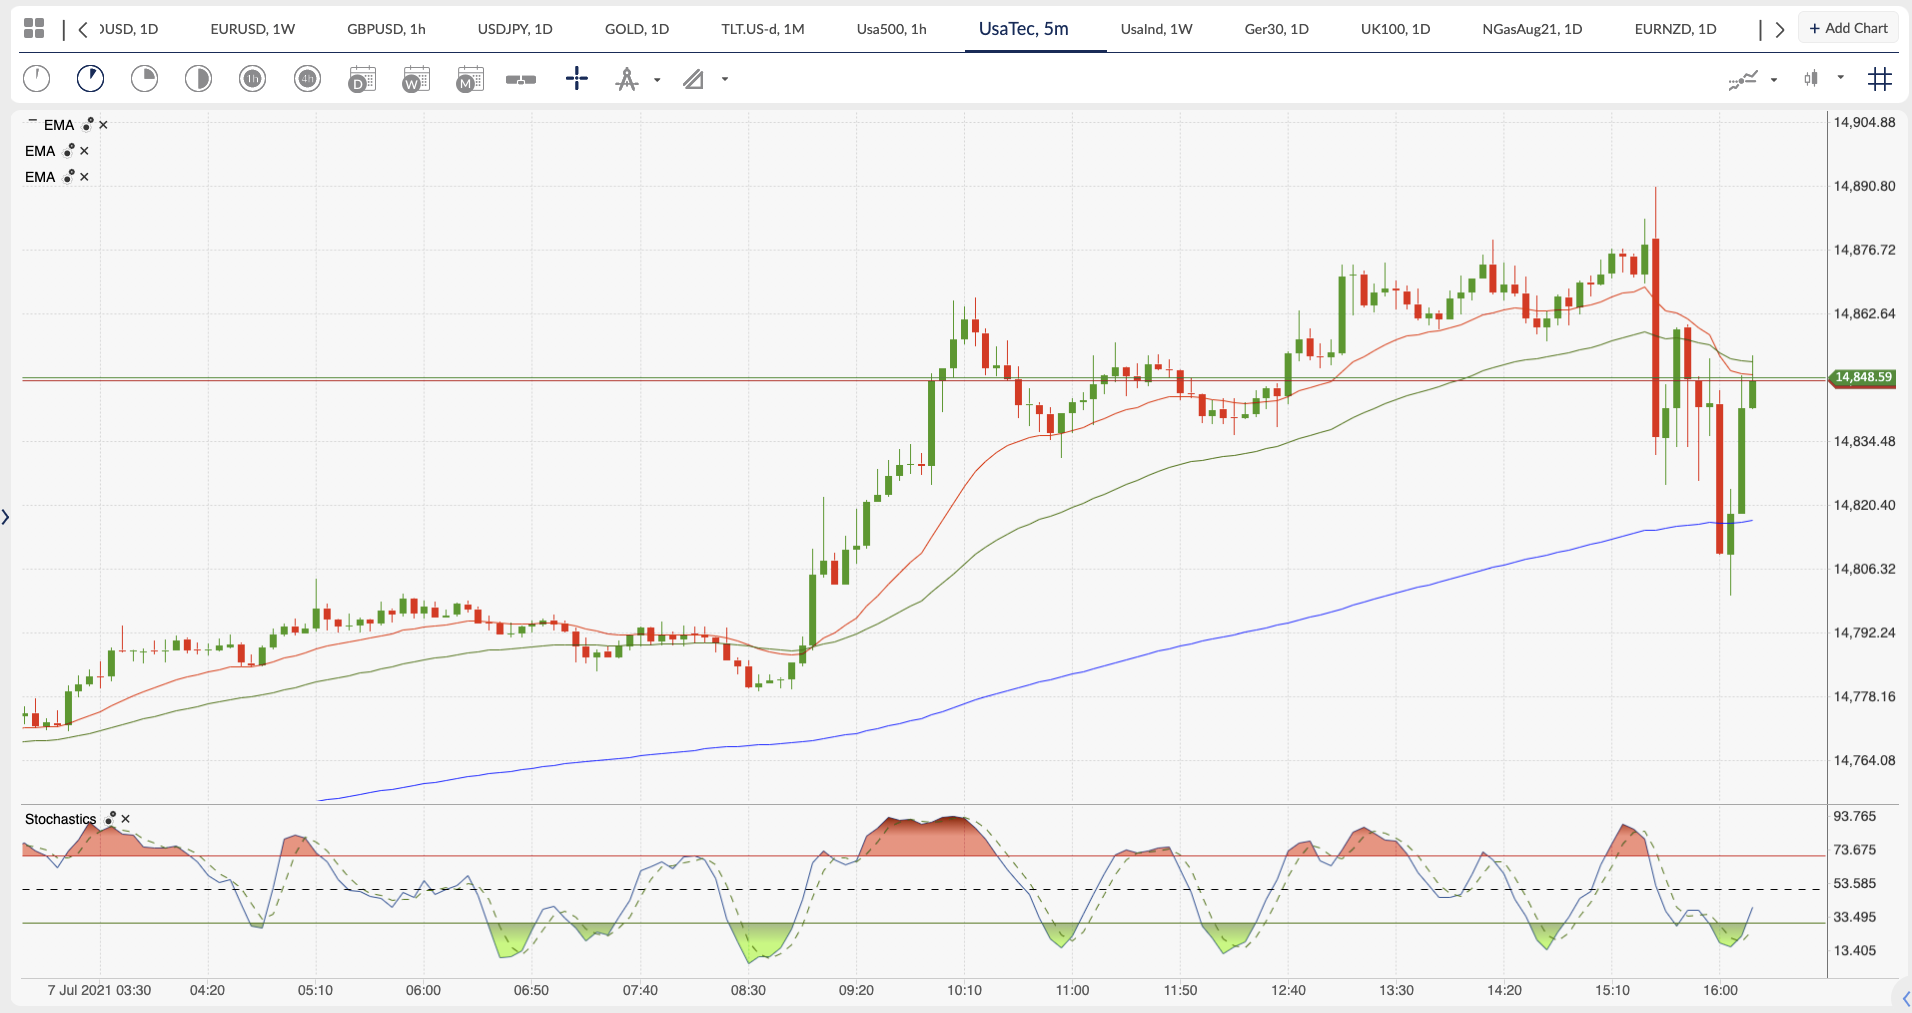
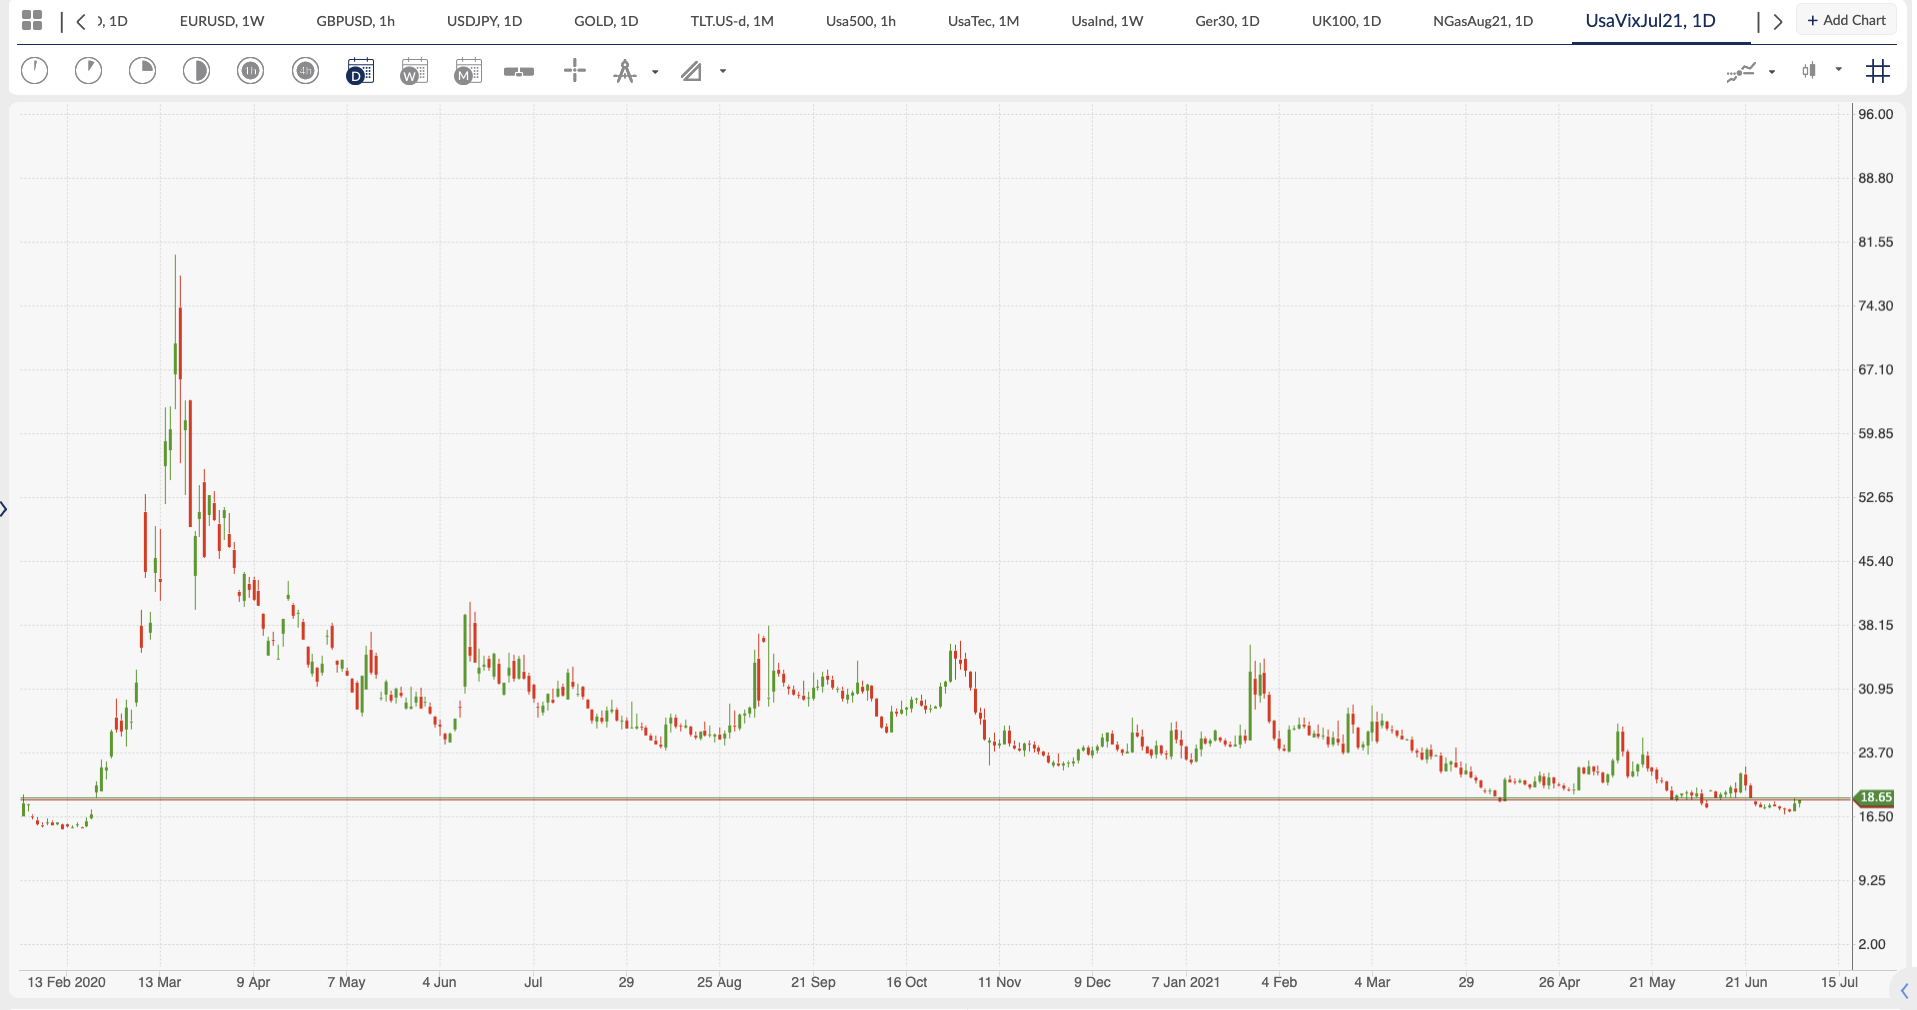
The S&P Volatility Index is showing that volatility has dropped back to pre-pandemic fear levels. Today’s VIX is slightly higher from the US open, and this translated into the pullback we saw on the lower time frames for the Nasdaq. If you use the trend following buy the strategy, waiting for the VIX to continue making lower highs and lower lows on the same time frame as your analysis is a great timing indicator.

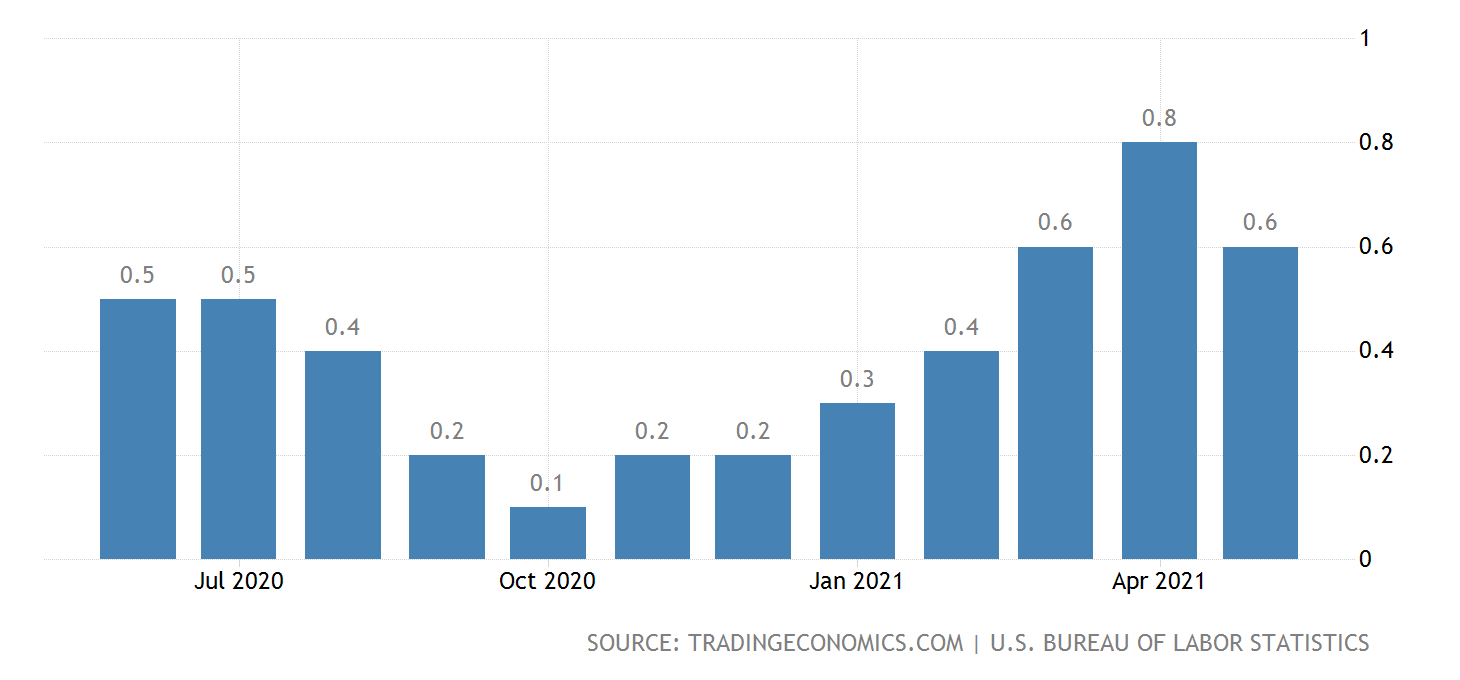
Inflation is also a key barometer of whether the indices are likely to carry on rising or not. I prefer to look at the rate of change as a steepening of inflation is not good, but a gentle rise is. Inflation can be a sign that an economy is growing, and that prosperity is increasing. Wages are a good metric to whether or not things are going well, especially when combined with good jobs data. Unfortunately, we are getting mixed results with these key macro fundamentals, so caution is needed. Which translates to don’t marry your position.

Today’s JOLTS job openings data showed that openings in the US hit a new record high. From the US Bureau of Labour Statistics:
On the last business day of May, the job openings level changed little at 9.2 million. The job openings rate was unchanged at 6.0 percent. Job openings increased in other services (+109,000), state and local government education (+46,000), and educational services (+35,000). The number of job openings decreased in arts, entertainment, and recreation (-80,000); state and local government, excluding education (-56,000); and federal government (-17,000).

However, rising financial stress, as stimulus fades and inflation fears percolates, is weighing on US economic optimism. From the Investor’s Business Daily: The IBD/TIPP Economic Optimism Index, an early monthly read on consumer confidence, slipped 2.1 points to 54.3 in July, the lowest since February. Readings above the neutral 50 level reflect optimism.

Tonight, we get to read what the FOMC meeting talked about and how well they feel the economy is doing. And whether the talk is moving in a more Hawkish manner or whether they are really concerned about something. They have been talking a lot about transitory inflation and if June’s change month on month comes in lower, the markets may concede that Chair Powell was right and the FOMC were correct to not raise rates this year so far.

The larger S&P500 can push the Nasdaq around as the S&P500 is now around 40% tech based. If the two are not following lock step, I tend to watch the S&P500 for long term direction and see if the Nasdaq pulls back more for a better entry. Keeping an eye on the largest tech companies by weighting can also give a quick heads up of which way the indices are likely to travel. Apple, Microsoft, Google, Facebook and Amazon are on my watch list, and everything becomes a lot easy to trade when they are all Green or Red.

While we are trying to work out the nuances of the macro fundamentals, I find it easier to keep following the daily time frame trend. Technical analysis at least keeps you in line with the higher time frame moves and out of the noise of the market intraday gyrations. Keeping the risk small and profit targets large means you only have to be right 45% of the time, so you can afford to take some trades even if they fail.

Tags: DOW JONESMacro-EconomicsNASDAQTechnical AnalysisUSA500VIX
Previous Post

Oil market turmoil as OPEC+ impasse threatens cartels future cooperation

Next Post

OPEC+ impasse is causing Oil to drop, US markets bid ahead of FOMC minutes

Next Post
OPEC+ impasse is causing Oil to drop, US markets bid ahead of FOMC minutes

OPEC+ impasse is causing Oil to drop, US markets bid ahead of FOMC minutes

CALL US

Categories
  • Commodities
  • Economy
  • Forex
  • Index
  • Insights
  • Markets
  • Opening of the Week
  • Sem categoria
  • Stocks
  • World

Site Map

  • Home
  • Markets
  • Charts
  • Economic Calendar
  • World
  • Economy
  • Insights
  • About Us
Português Español русский

A comprehensive website for traders, both experienced and new! Checkout our content and learn how to invest and speculate in the markets using margin traded products. Our team of educators has extensive experience and is here to help. Enjoy!

Follow us on social media

Risk Warning

All financial products traded on margin carry a high degree of risk to your capital. They are not suited to all investors, please ensure that you fully understand the risks involved, and seek independent advice if necessary.

All Rights Reserved - YouTrading UK 2020

Privacy Policy and Terms and Conditions
  • Home
  • My Academy
    • Register Now
    • Login
  • Markets
    • Opening of the Week
    • Stocks
    • Commodities
    • Forex
    • Index
  • Charts
  • Economic Calendar
  • Economy
  • World
  • Insights
  • About Us
No Result
View All Result

© 2020 YouTrading UK - Leaders in Trader Training.

We use cookies on our website to give you the most relevant experience by remembering your preferences and repeat visits. By clicking “Accept”, you consent to the use of ALL the cookies.
Do not sell my personal information.
Cookie settingsACCEPT
Manage consent

Privacy Overview

This website uses cookies to improve your experience while you navigate through the website. Out of these, the cookies that are categorized as necessary are stored on your browser as they are essential for the working of basic functionalities of the website. We also use third-party cookies that help us analyze and understand how you use this website. These cookies will be stored in your browser only with your consent. You also have the option to opt-out of these cookies. But opting out of some of these cookies may affect your browsing experience.
Necessary
Always Enabled
Necessary cookies are absolutely essential for the website to function properly. These cookies ensure basic functionalities and security features of the website, anonymously.
CookieDurationDescription
__cfduid1 monthThe cookie is used by cdn services like CloudFare to identify individual clients behind a shared IP address and apply security settings on a per-client basis. It does not correspond to any user ID in the web application and does not store any personally identifiable information.
_wpfuuid11 yearsThis cookie is used by the WPForms WordPress plugin. The cookie is used to allows the paid version of the plugin to connect entries by the same user and is used for some additional features like the Form Abandonment addon.
cf_use_obThis cookie is set by the provider Cloudflare content delivery network. This cookie is used for determining whether it should continue serving "Always Online" until the cookie expires.
cookielawinfo-checbox-analytics11 monthsThis cookie is set by GDPR Cookie Consent plugin. The cookie is used to store the user consent for the cookies in the category "Analytics".
cookielawinfo-checbox-functional11 monthsThe cookie is set by GDPR cookie consent to record the user consent for the cookies in the category "Functional".
cookielawinfo-checbox-others11 monthsThis cookie is set by GDPR Cookie Consent plugin. The cookie is used to store the user consent for the cookies in the category "Other.
cookielawinfo-checkbox-advertisement1 yearThe cookie is set by GDPR cookie consent to record the user consent for the cookies in the category "Advertisement".
cookielawinfo-checkbox-necessary11 monthsThis cookie is set by GDPR Cookie Consent plugin. The cookies is used to store the user consent for the cookies in the category "Necessary".
cookielawinfo-checkbox-performance11 monthsThis cookie is set by GDPR Cookie Consent plugin. The cookie is used to store the user consent for the cookies in the category "Performance".
viewed_cookie_policy11 monthsThe cookie is set by the GDPR Cookie Consent plugin and is used to store whether or not user has consented to the use of cookies. It does not store any personal data.
Functional
Functional cookies help to perform certain functionalities like sharing the content of the website on social media platforms, collect feedbacks, and other third-party features.
Performance
Performance cookies are used to understand and analyze the key performance indexes of the website which helps in delivering a better user experience for the visitors.
CookieDurationDescription
YSCsessionThis cookies is set by Youtube and is used to track the views of embedded videos.
Analytics
Analytical cookies are used to understand how visitors interact with the website. These cookies help provide information on metrics the number of visitors, bounce rate, traffic source, etc.
CookieDurationDescription
_ga2 yearsThis cookie is installed by Google Analytics. The cookie is used to calculate visitor, session, campaign data and keep track of site usage for the site's analytics report. The cookies store information anonymously and assign a randomly generated number to identify unique visitors.
_gid1 dayThis cookie is installed by Google Analytics. The cookie is used to store information of how visitors use a website and helps in creating an analytics report of how the website is doing. The data collected including the number visitors, the source where they have come from, and the pages visted in an anonymous form.
Advertisement
Advertisement cookies are used to provide visitors with relevant ads and marketing campaigns. These cookies track visitors across websites and collect information to provide customized ads.
CookieDurationDescription
_fbp3 monthsThis cookie is set by Facebook to deliver advertisement when they are on Facebook or a digital platform powered by Facebook advertising after visiting this website.
fr3 monthsThe cookie is set by Facebook to show relevant advertisments to the users and measure and improve the advertisements. The cookie also tracks the behavior of the user across the web on sites that have Facebook pixel or Facebook social plugin.
IDE1 year 24 daysUsed by Google DoubleClick and stores information about how the user uses the website and any other advertisement before visiting the website. This is used to present users with ads that are relevant to them according to the user profile.
test_cookie15 minutesThis cookie is set by doubleclick.net. The purpose of the cookie is to determine if the user's browser supports cookies.
VISITOR_INFO1_LIVE5 months 27 daysThis cookie is set by Youtube. Used to track the information of the embedded YouTube videos on a website.
Others
Other uncategorized cookies are those that are being analyzed and have not been classified into a category as yet.
CookieDurationDescription
_gat_UA-42160853-21 minuteNo description
cf_ob_infoNo description
CONSENT16 years 8 months 3 days 6 hours 2 minutesNo description
SAVE & ACCEPT
Powered by CookieYes Logo