The VIX performed one of the largest single-day spikes in recent months last week as fears over the COVID-19 Delta variant harming the global economy caused a major position adjustment in financial markets, which in turn provoked a spike in volatility.
The VIX has been subdued over recent weeks, largely due to the so-called summer doldrums and a steady rise in stocks and a gradual decline fears that the US Federal Reserve is going to increase rates and cut QE any time soon.
In fact, the latest spike in the VIX highlights just how far the FED may be away from turning hawkish. If we continue to see US data underperforming and inflation rising, then the FED will be left will a real dilemma in terms of what to do with policy.
When stock markets start to decline, the VIX comes into its own. The VIX can suddenly explode into life when US stocks start to come-off, making it in an essential tool to gauge the validity of a sudden market decline in stocks.
Typically, if the VIX is depressed and stocks are falling it may just be a technical move or a short-lived pullback. However, if the VIX is exploding higher and stocks are melting down then it is time to pay attention, albeit last week we got a small taste of what may be in store down the road if growth prospects dwindle away.
Traders looking to gain exposure to expected or current volatility traditionally look to trade the VIX. It is often said that expecting volatility is the best way to trade the VIX, rather than trading the index after a volatility breakout has occurred.
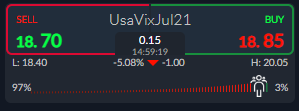
The ActivTrader market sentiment toll shows that some 97 percent of traders are expecting the VIX to decline further and negative sentiment is now at historically low levels. Such a bearish one-way skew is alarming and could cause a significant counter to move if the economic environment changes.


