The US dollar index is approaching a critical juncture on the foreign exchange and the Singapore Monetary Authority kept interest rates and monetary policy unchanged today. Ahead of today’s inflation report, it could be a good time to look at the USDSGD pair.
As China gathers increasing influence over the Hong Kong banking sector, capital outflows have been seen moving into Singapore as the country enjoys free capital markets, economic success and stability.
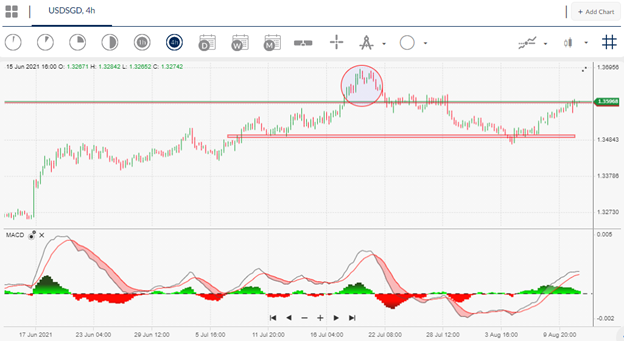
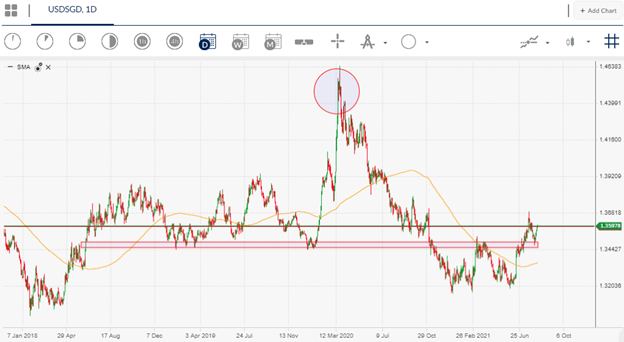
When the USDSGD starts to trend it typically means that a directional trend is here to stay. Simply put, the typical average daily trading range on USDSGD does not usually exceed 80-100 pips. However, when a large trending move does ensue on USDSGD it is a great indicator that the USD is going to make a huge move.
Additionally, when you see the USDSGD pair really trending in one direction and breaking key technical levels because it indicates genuine buying or selling interest taking place
This could be for a variety of reasons, such as the Singapore dollar is the chosen Asian safe haven economy by many of the Asian elite, as it has gathered a reputation as the financial hub of Asia.
Many wealthy individuals across the world, banks, and even corporations choose Singapore for its lower tax rates and high standards of regulation. It is therefore possible to say that the Singapore dollar has a safe-haven element to it.
Because of the stability of the country and relatively stable economic performance of Singapore, we rarely see the currency driven by political uncertainty. One word describes the Singapore dollar well, Stable.
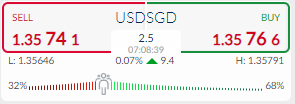
Sentiment is also on the side of a swing traders as 68% are becoming too bullish, meaning that a one-way skew is started to develop. At the moment, I do not see the sentiment becoming that large, however, it should be acknowledged.


