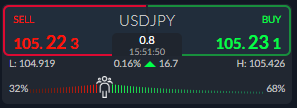
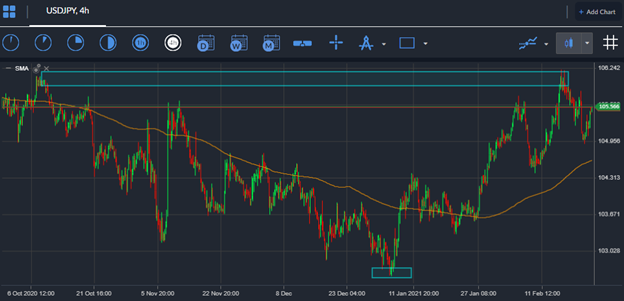
The US dollar came under pressure against the Japanese yen currency earlier this week, as the pair remained in technical correction mode after its recent bullish run towards the 106.00 resistance level. Positive technical signs are now emerging after the pair once again bounced from the 105.00 handle.
A confluence of important moving averages is currently located between the 105.40 to 105.60 area, including the 200-period moving average on the one-hour time frame and the pair’s trend-defining 200-day moving average.
The 105.40 to 105.60 area is therefore the key price area bulls need to completely overcome to encourage a break above the 106.00 resistance area this week, and prompt further possible gains towards the 107.00 price zone.
The prospect of further stimulus from the Bank of Japan seems less likely now that global lockdown may soon be ending. The central bank has a key policy review in the upcoming March BoJ meeting, which could determine the fate of the USDJPY pair.
It must be said that the overall direction of the US dollar index is probably going to have a major pull on the USDJPY pair in the near-term. The USDJPY pair has been decoupling from stock market correlations and following the direction of the US dollar.
Increasingly, the bond market has been driving the moves in the foreign exchange market this month. However, the Japanese yen, a vehicle of choice for safe-haven traders has been coming into favour with traders this week as tech stocks suffer.
Should we see more weakness in the S&P 500 and the Nasdaq then it could certainly harm the upside in the USDJPY pair. Watching those two indices’, and the Nikkei 225 closely this week will be advantageous if equity markets turn south.


