The US dollar has recovered back towards the 1.2700 level against the Canadian dollar, due to a major rally in the US dollar index and a minor unwinding from a new yearly high in oil price.
With Crude oil bursting through the former yearly high, and looking incredibly bullish again, the USDCAD pair could be one to watch if we see a huge, inverted head and shoulders pattern activated that Crude has just formed.
See real-time quotes provided by our partner.
USDCAD bulls will be keeping a close watch on Crude oil around the $77.00 price mark, because if the mentioned pattern is activated we could be looking at a coming rally above the $90.00 level for crude.
With the pattern showing that Crude has a large amount of scope to rally higher into year-end, this could be very bullish for the Canadian dollar. The main issue for USDCAD bears is the USD index.
The US dollar index is starting to test towards the top end of yearly trading range, around the 94.50 to 94.70 area. The longer the upside failure around the top of the range lasts then the stronger the chances of downside pressure on the USDCAD pair forming, and a potential slump back towards the yearly range low.
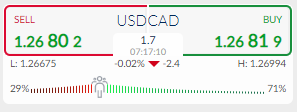
High levels of positive sentiment are still seen towards the USDCAD pair, with some 71 percent of traders holding a bullish view towards the USDCAD pair. This strong bullish sentiment is a warning a correction could be looming.
I would suggest keeping a close eye on sentiment if it starts to increase and the USDCAD corrects lower. Historical data has shown that retail traders are often on the wrong side of the price trend of exit too early when a new trend forms.
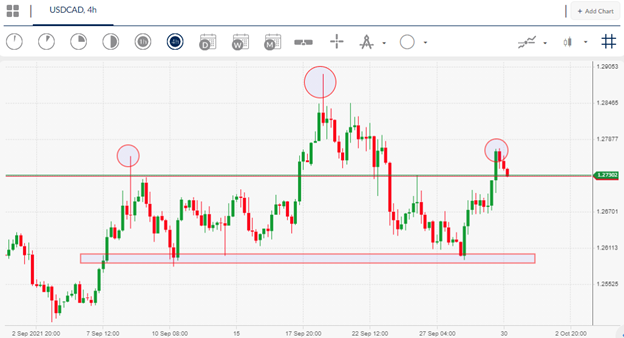
USDCAD Short-Term Technical Analysis
The four-hour time frame shows that a large head and shoulders pattern continues to form, with the latest bounce from the 1.2600 area helping to form a first probably right-handle shoulder.
Significant amounts of bearish MACD price divergence has formed during this recent price rise and extends towards the 1.2280 support area. Watch out for further losses as the divergence continues to unwind if the 1.2580 area cracks, which is also neckline support.
See real-time quotes provided by our partner.
USDCAD Medium-Term Technical Analysis
A bearish double-top has recently formed with the recent series of upside failure above the 1.2900 resistance level. Double tops are amongst the most bearish price patterns.
Much will depend on oil prices and the breakout in the US dollar index over the coming days to determine whether the bearish double-top pattern holds or is actually broken.
See real-time quotes provided by our partner.