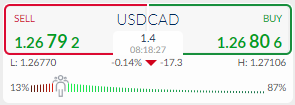
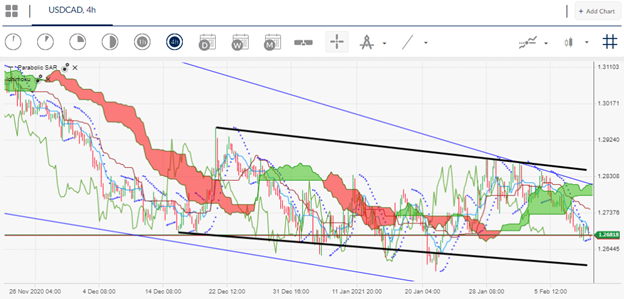
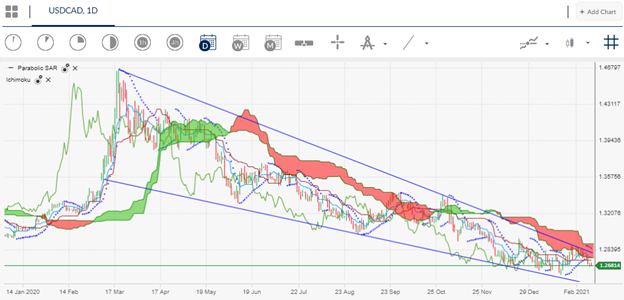
The US dollar is still under heavy selling pressure against the Canadian dollar as traders continue to sell any meaningful rallies in the USDCAD pair above the 1.2700 level. Going forward, the stage is set for further downside towards fresh multi-year lows.
Technical analysis continues to point to a coming drop towards the 1.2400 level across various time frames, while the fundamentals are very much in the favour of further USDCAD losses while oil price continue to rise.
Sticking with the topic of oil, the ongoing rise in West Texas Intermediate is a vital factor which is underpinning strength in the Canadian dollar this year. The price of oil and the Canadian dollar have a strong positive correlation, hence why oil trading at multi-year highs has implications for the USDCAD.
Something else to consider is the fact that oil prices could strengthen into the next OPEC meeting. If this scenario comes to fruition it is increasingly likely that weakness in the USDCAD is likely to persist.
The next part of the USDCAD trade is weakness in the greenback. The US dollar index has start to unravel again, which is causing concern that the overall down trend in the buck is about to move into its next phase.
If we consider that ongoing QE, more stimulus, and weak inflation are all conducive for a weak US dollar environment, then there is little reason to be bullish towards the US dollar currency at this moment.
Another factor that is also adding to my conviction about the USDCAD weakening is market sentiment. According to the Activtrades Market Sentiment tool, nearly 90% of traders are bearish towards the USDCAD pair.


