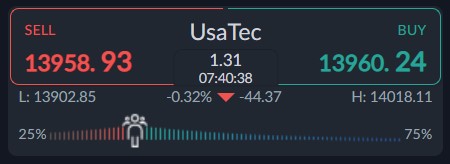
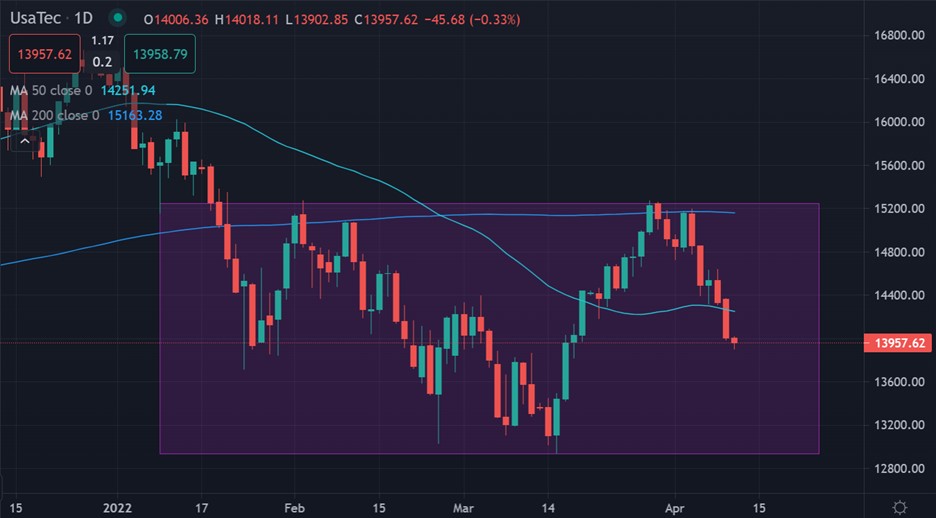
The Nasdaq has crashed towards the 13,900 level after rising COVID-19 cases in China and a round of hawkish FED speaker caused a mini-meltdown in global stock markets on Monday.
U.S. tech stocks dropped sharply across the board on Monday as investors looked ahead to the start of corporate earnings season this week and a slew of new economic data.
The Nasdaq dropped more than 2% as technology stocks came under renewed pressure. Treasury yields climbed, and the benchmark 10-year yield rose above 2.7% to reach the highest level since January 2019.
Today traders are set to receive the latest Consumer Price Index from the Bureau of Labour Statistics, which is expected to show a staggering 8.4% year-over-year increase in prices for the biggest leap since 1982.
Fed officials increased talked of larger-than-average 50 basis-point interest rate hikes this year to help bring down prices. Additionally, the next FED meeting is about three-weeks away.
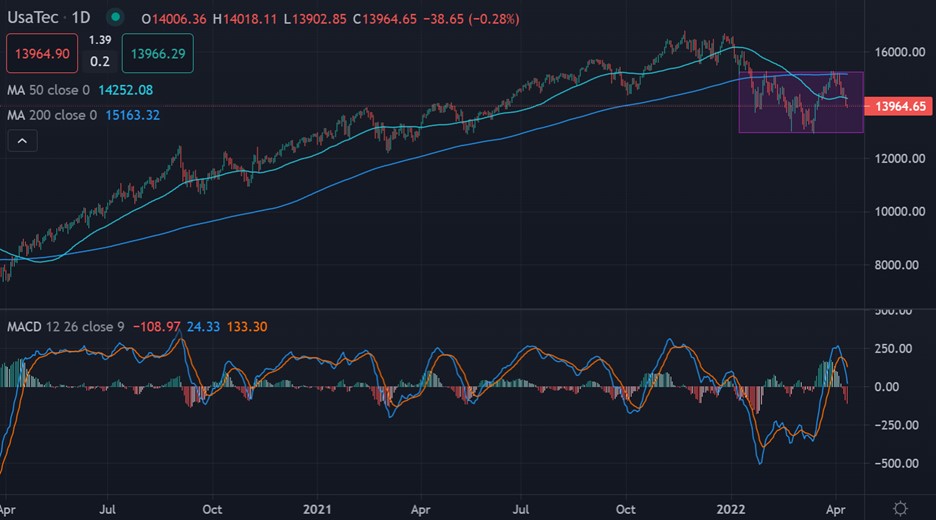
Going forward, the Nasdaq has scope to bounce from the 13,000 level, because this is where long-term negative divergence has existed, and is now completely eroded. Additionally, bullish pattern is building.
The ActivTrader market sentiment tool is showing that some 75 percent of traders are bullish towards the US dollar index, which is an increase of around 12 percent since last week.
The fact that sentiment is still very bullish is worrying for more losses. I would prefer the herd to flip to negative before I think we see a meaningful price bottom forming for the Nasdaq.


