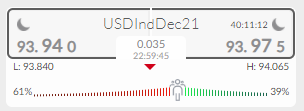
The US dollar index had another mixed week on the foreign exchange market last week as bulls were unable to gain traction above the 94.50 level, while sellers were incapable of cracking the key 93.70 support level.
Mixed data from the US economy does not help the case for a major breakout. Additionally, as inflation expectation rise globally, the US central bank is not the only central bank taking a more hawkish shift.
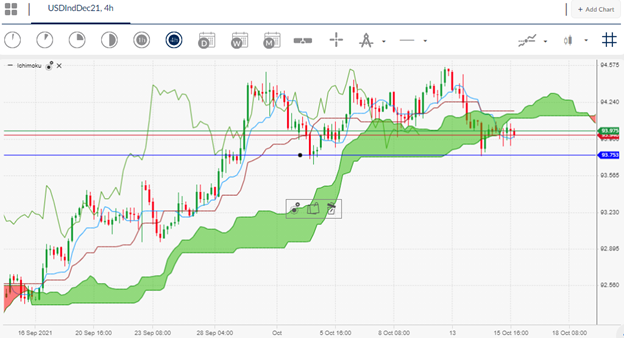
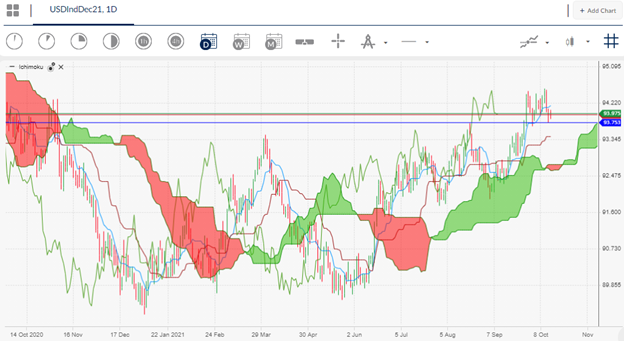
Make no mistake the 93.70 to 94.50 region is once again the key range to watch. Should we see the 93.70 level broken a massive price decline in the US dollar index towards the yearly low could happen.
This technical fact is causing trepidation in the market. Additionally, the same is also true to the upside, and if the 94.50 resistance level is broken we could be seeing the DXY testing to close to the 96.00 level.
Some warning signs are also present of a coming breakdown in the buck. The EURUSD pair is around its most oversold ever, and the British pound is starting to show some very positive signs.
The ActivTrader market sentiment tool is showing that some 61 percent of traders are bearish towards the US dollar index. This is a minor increase since last week and speaks to the fact that an overall neutral bias is still in place.


