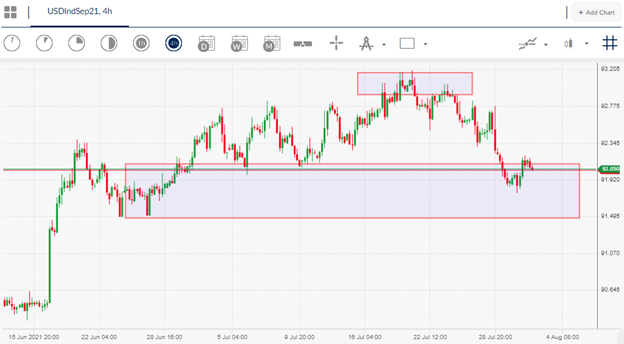
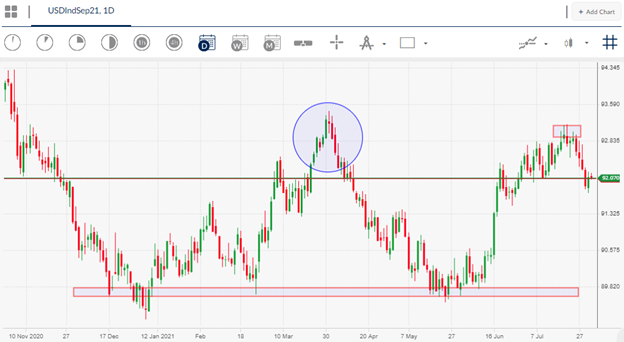
The US dollar currency had a bad week on the foreign market last week as bears took control of the greenback after the FOMC meeting, sending the US dollar index back towards the 92.00 support zone.
As the new month of August begins seasonal trends, risk tones, and top tier economic data from the United States economy are the major themes that US dollar trades need to pay close attention. A strong case exists for a US dollar rebound in August, however, it is far from certain.
Seasonal trends for August usually favour US dollar strength, with safe haven asset classes coming back into favour with traders. August is also the strongest month for 10-year yields, pointing to a further decline in yields and gains in the greenback.
Further reasons for traders to be optimistic towards the US dollar include a 900,000 plus prediction for the July Non-farm payrolls job report and estimates of plus 7 percent for Q2 US GDP.
Risk-off tones are also present in the market, which usually favour safe haven trades such as the US dollar and the yen. Soft Q2 results, weak Chinese data, and below estimates forward guidance from AMAZON and APPLE have started to spook the market.
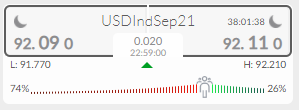
The ActivTrader market sentiment tool is also showing that sentiment is very bearish towards the buck, which indicates to me that the US dollar index could stage a short-term rebound at any time.
It should be noted that bearish sentiment is at 74 percent, which indicates to me that too many traders are selling the US dollar right now. I would rather see high levels of bullish sentiment in order to believe the bear case has legs.


