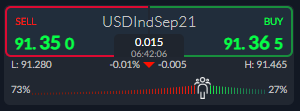
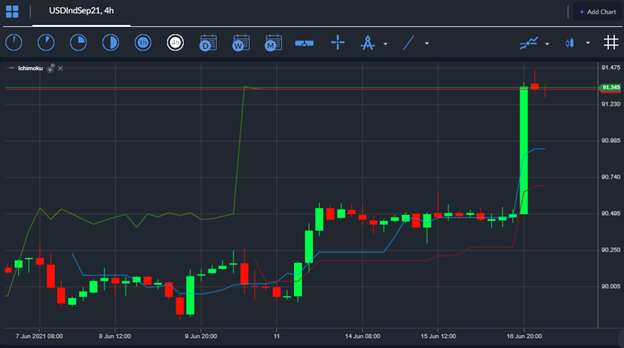
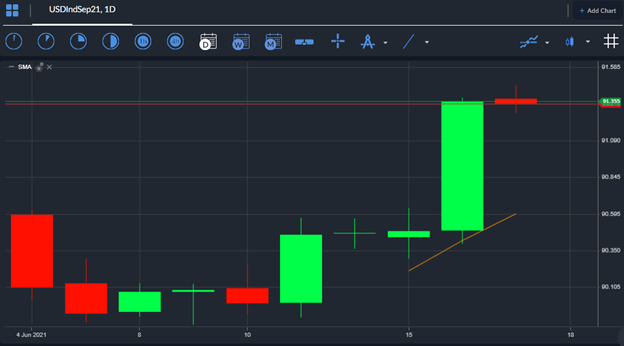
The US Dollar Index has staged a major breakout on the foreign exchange market over the last twenty-four hours after the Federal Reserve sounded much more hawkish towards the US economy and inflation than markets had been expecting.
Wednesday’s policy statement acknowledged the ongoing inflationary pressures in the US economy, while Federal Reserve economic projections improved, which meant that market participants now expect the FED to taper and raise interest rates sooner than previously anticipated.
Traders and investors reacted by buying the US dollar currency, with major currency pairs like the EURUSD and GBPUSD tumbling, and the USDJPY and USDCHF racing higher, placing the US dollar in a strong position on Thursday.
It must be said that the pace of gains in the US dollar would have been even greater had it not been for the AUDUSD and NZDUSD pairs. The Australian dollar rallied this morning over the incredibly strong May jobs report, while the New Zealand dollar rallied after the release of strong GDP data.
US dollar bulls could easily take the index towards the 91.80 to 92.00 levels according to the charts. The EURUSD pair makes up a significant portion of the US dollar index. With the euro weakening now, it bodes very well for further gains, as does the ongoing shift in sentiment towards the buck.
The ActivTrader market sentiment tool is showing that a massive sentiment shift has taken place, with some 73 percent of traders now bearish towards the US dollar index. Just to underscore the shift underway, some 92 percent of traders were bullish towards the US dollar index last week.
The sudden one-way sentiment shift is likely to lead to losses gains the for the US dollar in my opinion as too many traders are bearish. Overall, ongoing sentiment metrics leave room for a rally towards the 92.00 area.
US Dollar Index short-term Technical Analysis
Looking at the four-hour time frame a large head and shoulders pattern is still in play, with bulls needing to move the price above the 93.30 area to invalidate the bearish price pattern.
The bearish price pattern may be forming a final right-hand shoulder, which means that the US dollar has plenty of scope to advance over the coming days before the US dollar finally rolls over. Gains above the 91.50 area is likely to lead to the 92.00 area in the short-term.
See real-time quotes provided by our partner.
US Dollar Index Medium-term Technical Analysis
According to the daily time frame, the US dollar index has started to test towards its key 200-day moving average, around the 91.50 level, after moving above its 7, 20, and 50-day moving averages after the FOMC meeting.
Gains above the 200-day moving average, around the 91.50 level would be very positive for the US dollar index. This would place the 92.00 and 92.30 areas as the big targets, prior to the yearly high, around the 93.30 level.
See real-time quotes provided by our partner.