The US dollar index is once coming under pressure from all directions this week, as the greenback falls to multi-lows against the British pound, Japanese yen, and a selection of commodity-related currencies.
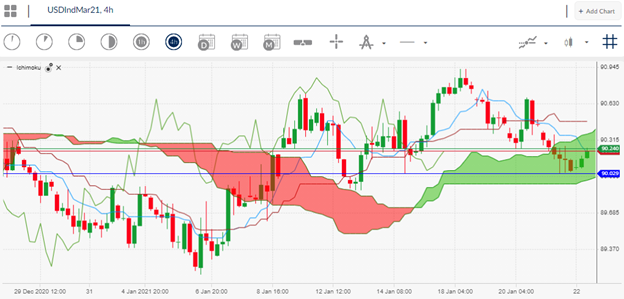
Intraday traders will also have noticed that the short-term trend for the US dollar index turned bearish once again yesterday, after the price slipped below the 200-period moving average on the four-hour time frame.
Officially, the short-term trend for the US dollar index turned bullish on the January 15th for the first-time since November 5th last year, meaning that bulls were only able to hold onto the new short-term trend for five days.
Traders and investors were becoming more bullish towards the US dollar ahead of Joe Biden’s inauguration this week, however, US Treasury Secretary Janet Yellen’s hawkish tone towards policy stimulus caused the recent recovery to reverse course.
Yellen also failed to mentioned US dollar weakness and clearly stated the Biden administrations intention for the foreign exchange market to determine the rate of exchange for the US dollar currency.
Going forward, the US dollar index has a key test today due to the release of the preliminary US manufacturing PMI for the month of January. The US dollar could start to gain strength if the headline number outperformers and inflationary pressures show up inside the report.
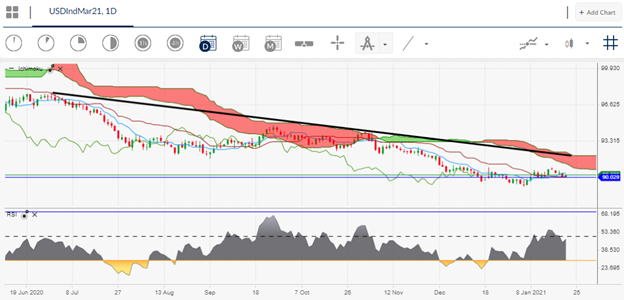
If the manufacturing PMI comes in as expected and inflationary pressures are muted, then I suspect that the overall down trend in the US dollar index will continue, and the US stimulus narrative will continue to dominate.
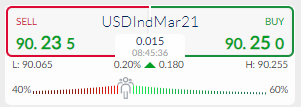
Looking at market sentiment, the ActivTrader Market Sentiment tool shows that some 60 percent of traders are bullish towards the US dollar index. This is interested because the trend has been lower and traders are expecting the greenback to start to strengthen, despite the negative bias over recent days.


