The US dollar index has taken a big hit after the Jackson Hole Economic Symposium caused the buck to weaken against most major and emerging currencies, due to FED Powell sounding more dovish than expected.
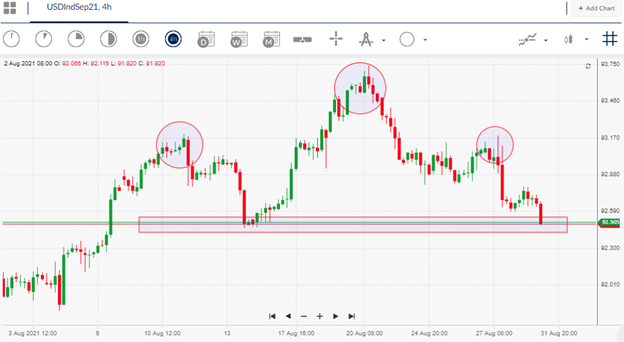
The pace of the reversal from the 93.70 area could suggest that a major price top has now formed and that a false breakout above the former yearly high, set in April, may have taken place early this month.
Much will depend on the pace of the follow-through of the bearish technical reversal, and indeed the fundamentals. Technicals are very important here, but without a doubt, jobs will be the key factor that will set the tone for the buck in September.
Chair Powell mentioned that the US economy is not back to full employment and that the FED are closely watching the COVID-19 development. The slowing pace of job creation and rising COVID-19 cases will almost certainly cause more US dollar losses.
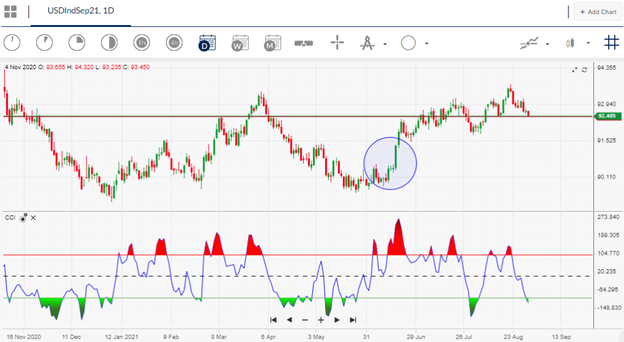
The opposite is also true, so as things stand this week is going to be hugely important for the tone towards the US dollar in September. We should acknowledge that the technical show large amounts of bearish price divergence, so I am currently leaning towards more downside for the greenback over the coming weeks.
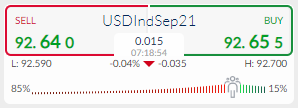
It should be noted that sentiment is currently on the side of the bulls. The ActivTrader market sentiment tool is showing that some 85 percent of traders are bearish towards the US dollar index.
Typically, one-way bearish sentiments skews are warning us that the herd is too short for the market. It is worth us acknowledging that we probably need to see bearish sentiment dropping in order for the US dollar to decline further.