The US dollar index had another mixed trading week last week as an initial sell-off in the greenback quickly reversed as traders digested as combination of factors, such as Chair Powell’s dovish inflation comments, a multi-year high year-on-year US CPI inflation reading, and a better-than-expected US Retail Sales report.
A big dip in US Consumer Sentiment and the COVID-19 variant caused risk trades to become front and centre, with stocks moving into the red, commodity prices falling, and traders flocking into the safety of the greenback.
The COVID-19 Delta variant is going to be something to watch this week for US dollar traders. Based on past price behaviour, and what we witnessed last Friday, COVID-19 fears are bullish for the buck.
One of the major red flags to watch this week is sentiment. Traders have a huge negative bias towards the greenback at the moment, in fact sentiment has taken a big turn for the worse.
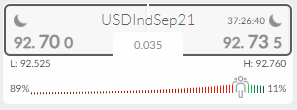
The ActivTrader market sentiment tool is showing that bearish sentiment has increased dramatically over recent weeks. Negative sentiment has increased to 89 percent, which is an increase of almost 10 percent from just one-week ago.
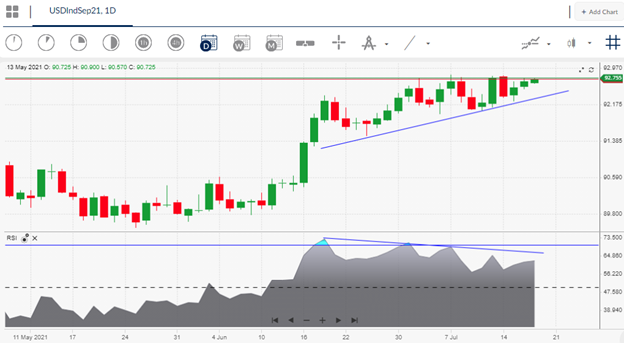
Heavy sentiment skews are often wrong, however, it should be noted that the trend is now bullish for the US dollar, as the index continues to push away from its 200-day moving average.
The one-way sentiment bias is indicating more gains are likely, at least in the early part of the week, especially since retail traders are running counter trend and in increasingly large numbers.


