The US Dollar Index has failed to catch a break this week, despite very strong retail sales and consumer price index inflation data, which would invariably be bullish for the greenback during better days.
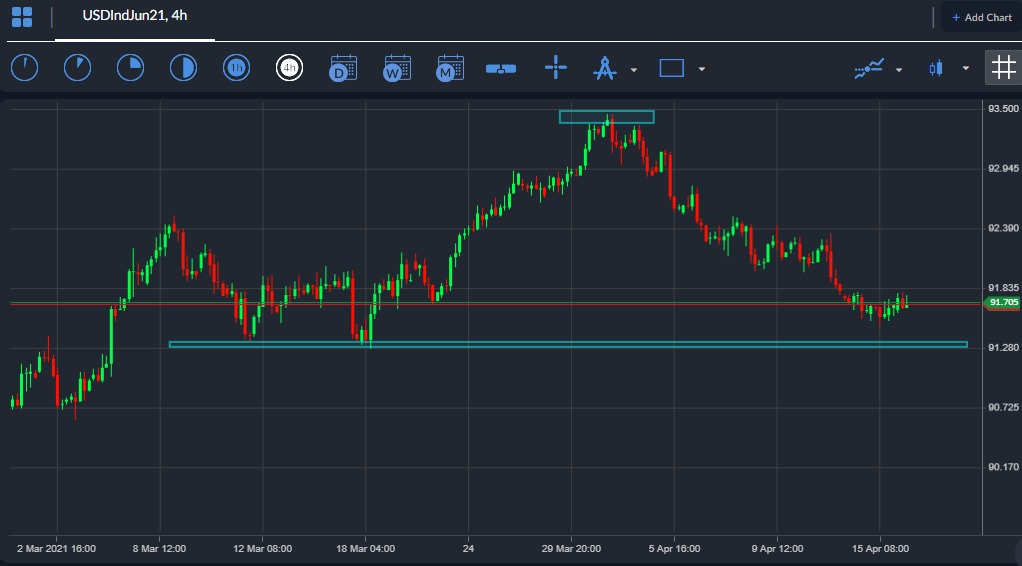
A high degree of negativity appears to have set in towards the US dollar, and this is most evident with the index’s failure to recover above its trend defining 200-day moving average over recent trading sessions. The US dollar index have various opportunities and reasons to recovery but failed to do so.
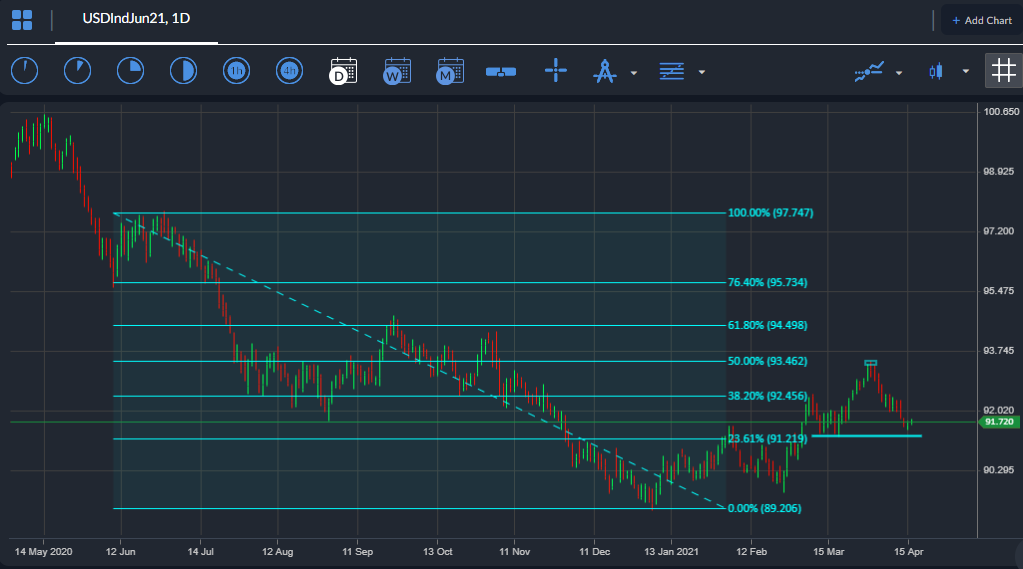
It is possible that the recent multi-week move higher towards the 93.50 mark may have just been a correction within a very pronounced bear market. Fibonacci analysis is currently suggesting that this indeed could be the case.
The recent move higher in the US dollar index stopped at the 50 percent Fibonacci retracement level of the current 2021 low to the technically important July 2020 swing-high, around the 93.45 resistance level.
Typically, in bull or bear markets, a 50 percent correction will take place in order to let traders enter into the prevailing trend. This usually happens as traders book profits, and for the lack of better word, as trend exhaustion takes place.
If this is the case the US dollar index is set for heavy loss this year. The fact that the greenback is failing to rally on positive data speaks volumes. The market conviction that the FED will keep rates low and not interfere with QE is probably contributing to this.
I would like to add a caveat to the bearish outlook. If the FED were to shock markets and change current policy or policy language a huge market shock could take place. But until that time, the trend is once again bearish.
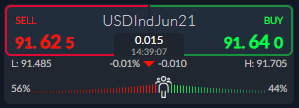
Some 56 percent of traders towards the US dollar index. The sentiment skew is not that large so I would probably take this current reading to mean that range bound trading contains could set in for a while.


