The US Dollar Index is starting to look more bullish, following the early-week recovery in US bond yields and the bumper plus 5 percent United States retail sales report. Better-than-expected PPI inflation data from the US economy also played into the narrative that the US economy is back-on-track.
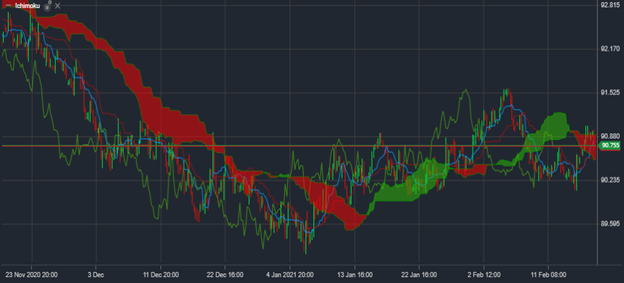
US dollar bulls have many things to be happy about right, given the sudden surge against gold and a number of top currencies. Something else to note is that the US dollar index’s technicals appear solid after the early-week recovery.
The EURUSD pair makes up a significant portion of the US dollar index. The big reversal from the 1.2160 area to the 1.2000 area has not gone unnoticed. Should we start to see the EURUSD pair breakdown it could propel the US dollar index to a fresh yearly high.
A degree of caution is advised here, as the US dollar index has been particularly choppy recently. However, the technical retest of the earlier-February breakout, and subsequent survival of critical support zone does bode well for the US dollar index.
What US dollar traders need to see now is momentum. The US dollar index and the EURUSD pair have seen increasingly lacklustre daily trading ranges. A confirmed directional breakout in EURUSD pair would ensure that adequate momentum could build and inspire confidence that a new trading range is formed.
Should we see the United States economic recovery story start to gain traction then it is likely that the US dollar index will continue on its current trajectory. The release of US manufacturing PMI will be especially important for the US dollar index this week.
Additionally, watch out for the German PMI manufacturing release on Friday. Any clear divergences forming between the United States and the eurozone economy could accelerate the EURUSD down trade.
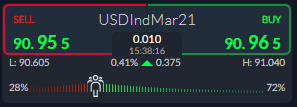
According to the ActivTrader Market Sentiment tool traders are overwhelmingly bullish towards the US Dollar Index. Retail traders typically exit new trends too early, so we will have to closely watch the sentiment gauge if the recovery takes hold.


