The FTSE100 has started to move higher after a recovery from days of losses in US stocks. UK stocks typically follow US stock markets, so a pullback in UK and subsequent recovery is common.
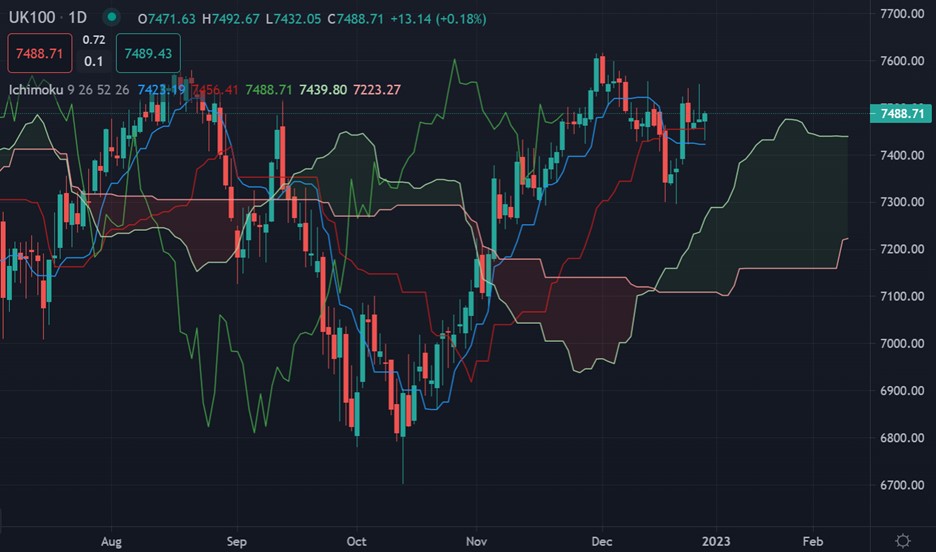
Going forward the UK100 is well placed for more gains despite the bearish economic backdrop, however, the road towards the 8,000 level is probably paved with some bumps and danger.
Blackrock, the world’s largest asset manager said, “We expect to turn more positive on risk assets at some point in 2023 – but we are not there yet”. This is also in line my price charts for stocks.
The asset manager also noted “What matters most, we think, is how much of the economic damage is already reflected in market pricing. This is why pricing the damage is our first 2023 investment theme.”
And they add that “Equity valuations don’t yet reflect the damage ahead, in our view. We will turn positive on equities when we think the damage is priced or our view of market risk sentiment changes. Yet we won’t see this as a prelude to another decade-long bull market in stocks and bonds.”
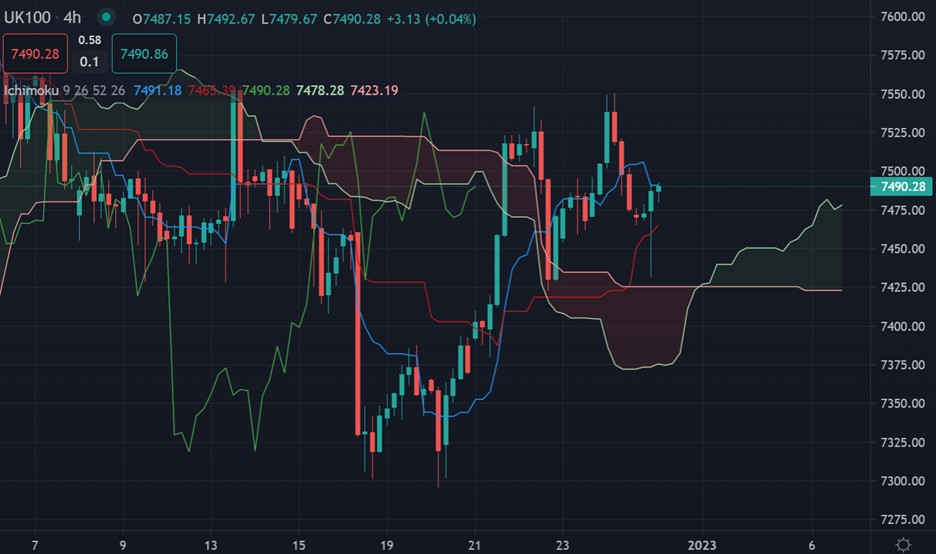
It is also noteworthy that the technical picture looks to be short-term bearish and medium-term bullish. More on this later as we now move towards current sentiment metrics.
Sentiment remains very bearish, which could be great for further price gains ahead for the UK100. With retail looking to short we could see the FTSE100 holding above the 7,500 level.
If we look at the ActivTrader Market Sentiment tool, 74 percent of traders are currently bearish. This metric has dropped 8 percent last week. However, more losses are likely. Based on the current sentiment reading I think it is highly probable that we could see the upside starting to accelerate.
UK100 Short-Term Technical Analysis
According to Ichimoku analysis on the four-hour time frame the UK100 has started to trade above Ichimoku cloud support and is well-supported on price dips and almost free from resistance.
A bullish inverted head and shoulders pattern has also formed, I would suggest keeping a close watch on the 7,550 level for incoming gains to activate the price pattern.
See real-time quotes provided by our partner.
UK100 Medium-Term Technical Analysis
The Ichimoku indicator daily time frame shows that the UK100 is clear of resistance and a move towards the 7,600 level would now help activated inverse head and shoulders pattern.
If we see the UK100 starting to move towards the 7,700 to 7,800 area, then the all-time is within touching distance. All eyes will be on a huge break next year.
See real-time quotes provided by our partner.