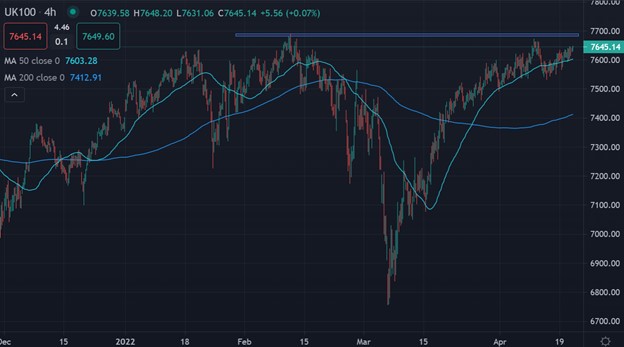
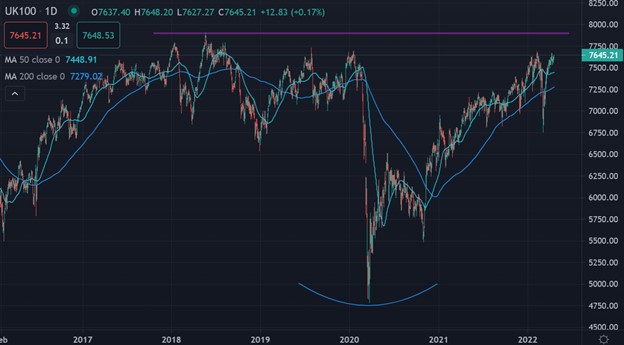
The FTSE100 has bounced from the 7,500-support area and is now starting to look bullish again, as the worst appears to be over for UK stocks and for the leading United Kingdom index.
Buyers are likely to target the current yearly high, around the 7,700-level next if the recovery continues. I also think we are likely to see the 8,000-resistance level being tagged sooner rather than later.
The market now looks ahead to comments from the central banks, with Fed chair Jay Powell the main focus for traders and investors. ECB President Christine Lagarde and Bank of England governor Andrew Bailey are also due to speak in Washington DC.
The recent Fed Beige Book pointed to a US economy that was starting to see negative impacts from rising prices, with inflationary pressures expected to continue for a few more months.
However the Beige Book showed that manufacturing activity was solid across districts, while office occupancy and retail activity increased, so it’s not all bearish going into Powell’s speech.
US markets have been choppy, while the FTSE100 has been an island of stability. The Netflix price crash has sparked volatility, which saw Netflix crash 35% lower and raised concerns that other high value areas of the market could suffer a similar fate if their earnings numbers fall short in the coming days.
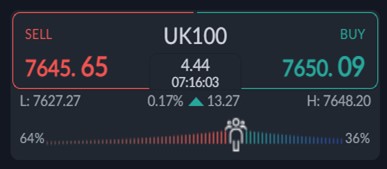
Sentiment towards the UK100 is very clear right now. According to the ActivTrader platform over 64 percent of traders are bearish towards the UK100. This is a drop since last week, but still worrying.
Typically, the retail crowd is on the wrong side of the trade more often than not, so the UK100 could continue to rise this week and month, which the price action and chart certainly suggests is possible.


