The FTSE 100 has been rallying away from the 7,000 level over recent days, which has gone counter to what stock traders had expected given that the UK faces the prospect of losing its Prime Minister.
Furthermore, dire economic warnings from the Bank of England about the state of the United Kingdom economy failed to dampen the buying interest towards UK stocks in general.
Yesterday, the expectations are that the Fed will confirm their hawkish stance during the Meeting Minutes were put to rest, as officials from the United States central bank talked up the risks of continued extreme rate hikes.
Going forward, investors are keeping a close eye on the latest developments at Number 10 as Boris Johnson’s premiership is still hanging on by a thread after both Rishi Sunak and Sajid Javid resigned.
On Wednesday, following another attempt to remove him, Boris Johnson made it clear he does not intend to leave Number 10, and has appointed Nadhim Zahawi as his new chancellor and Steve Barclay as health secretary.
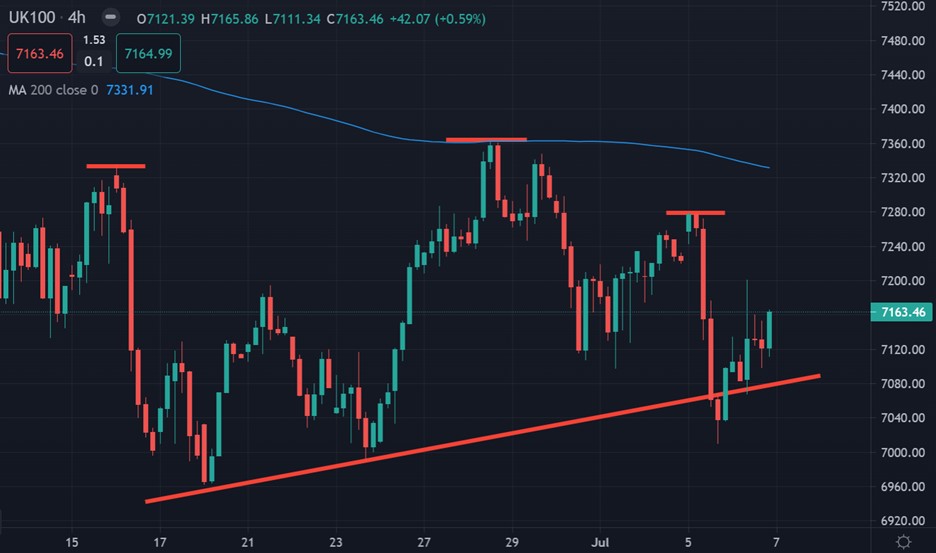
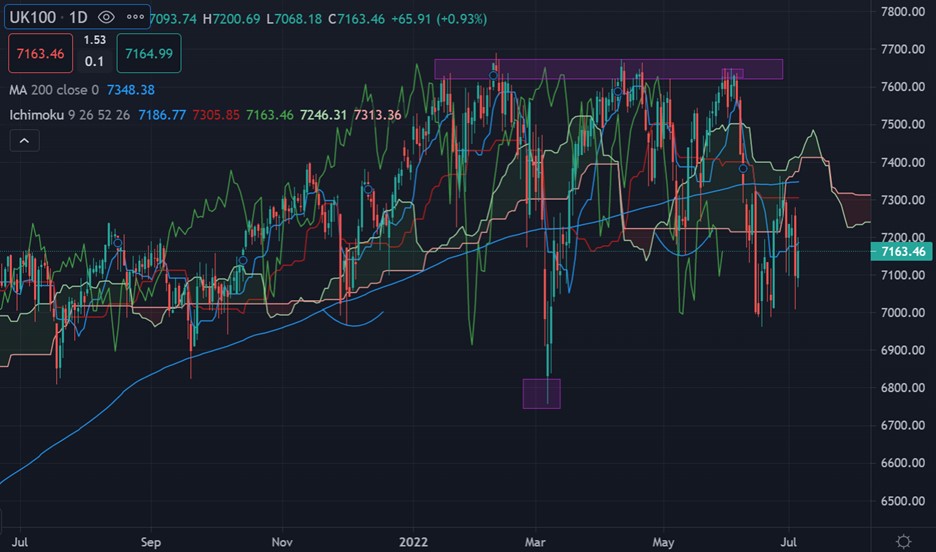
Going forward, technical traders need to see a break of the 7,000 to 7,360 price range before they are really sure about the direction of the FTSE100. The index is currently in no-man’s lands.
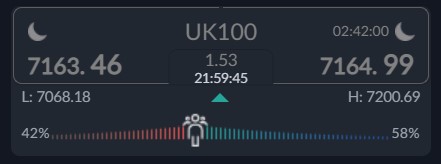
Sentiment towards the UK100 is also slightly bullish right now. According to the ActivTrader platform only 58 percent of traders are bullish towards the UK100. This is not a great sign for bulls.
Typically, the retail crowd is on the wrong side of the trade more often than not, so the UK100 could continue to drop, as the charts in the technical analysis section below certainly suggest.


