The FTSE100 share index has tested 8,000 points for the first time ever this week, as fears of global recession ease, the index of the largest 100 companies listed on the London Stock Exchange hit 8,005 points, a new record.
Shares were boosted as traders welcomed Wednesday’s release of better-than-forecast inflation numbers, raising hopes the Bank of England will not be bounced into hiking its rate further than markets are anticipating.
Data showed that the United Kingdom consumer prices index fell to 10.1% for January, down from 10.5% in December and more than the 10.3% that had been expected.
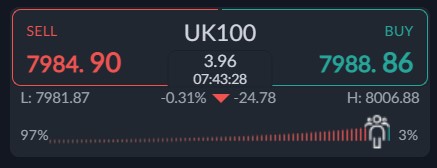
Sentiment metrics are warning of more upside as traders are now 97% short the leading UK index. Such metrics scream that a further counter move to the upside could easily happen.
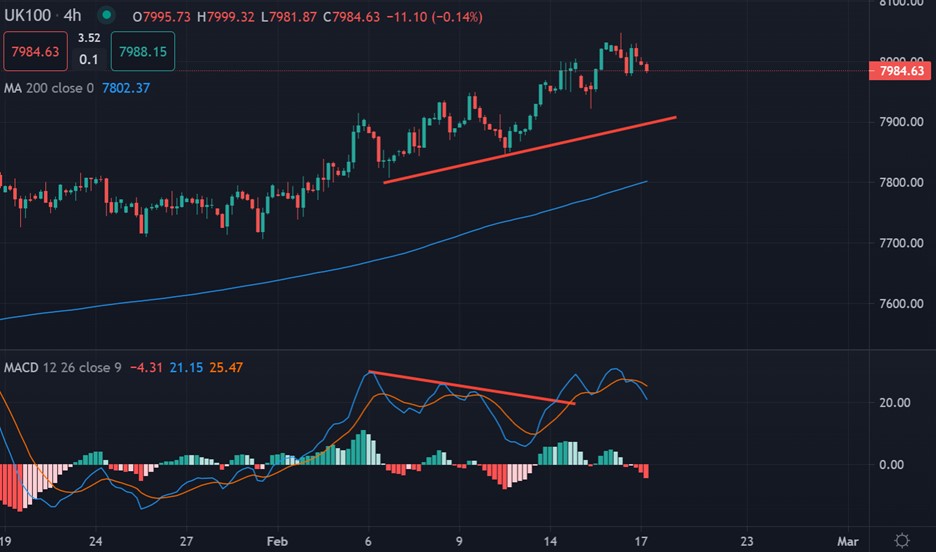
In the interim, layers of bearish MACD price divergence are warning that a correction may kick-in at any time. However, based on the recent multi-year range break the UK100 remains a strong buy on dips.
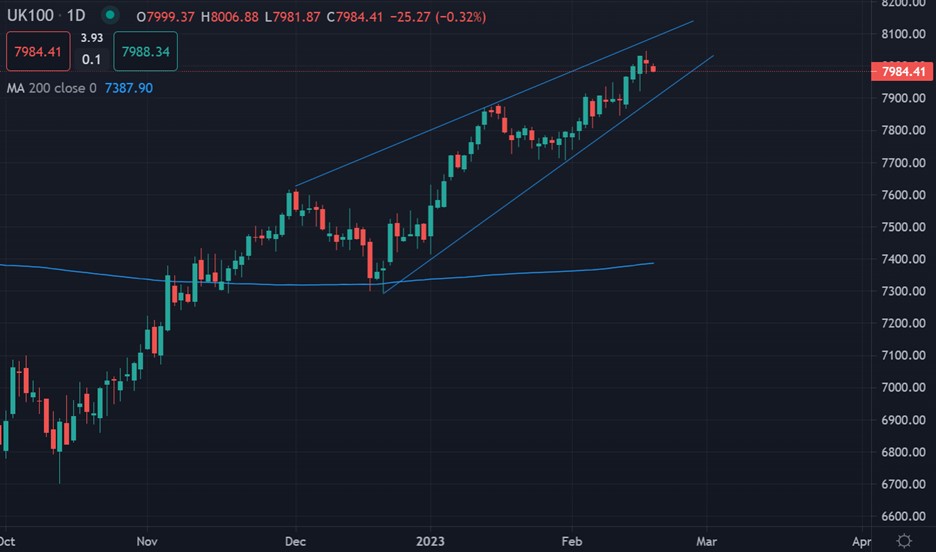
Now that we have seen the 8,000 level test I believe a generational buy could be unfolding and dips during the next few months could be a great chance to accumulate the UK100 for a big move towards the 8,000 level and beyond.
Sentiment remains very bearish, which could be great for further price gains ahead for the UK100. With retail looking to short we could see the FTSE100 holding above the 8,000 level.
If we look at the ActivTrader Market Sentiment tool, 97 percent of traders are currently bearish. This metric has increased by 10 percent since last week. However, more losses are likely.
Based on the current sentiment reading I think it is highly probable that we could see more upside, which is a concern for shorts right now.
UK100 Short-Term Technical Analysis
According to the MACD indicator on the four-hour time frame the UK100 has started to form huge layers of bearish MACD price divergence.
This should be a concern for bulls, but it also could be an encouraging sign for accumulators who would like a final chance at buying close to the 7,800-support zone.
See real-time quotes provided by our partner.
UK100 Medium-Term Technical Analysis
The daily time frame shows that the UK100 is clear of resistance and a move towards the 8,100 level would certainly be possible based on the current price pattern.
If we see the UK100 starting to move towards the top of a rising wedge pattern. This certainly hints that a correction could take place from at least the 8,100 area.
See real-time quotes provided by our partner.