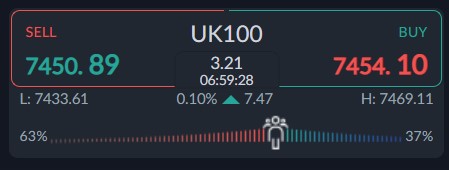
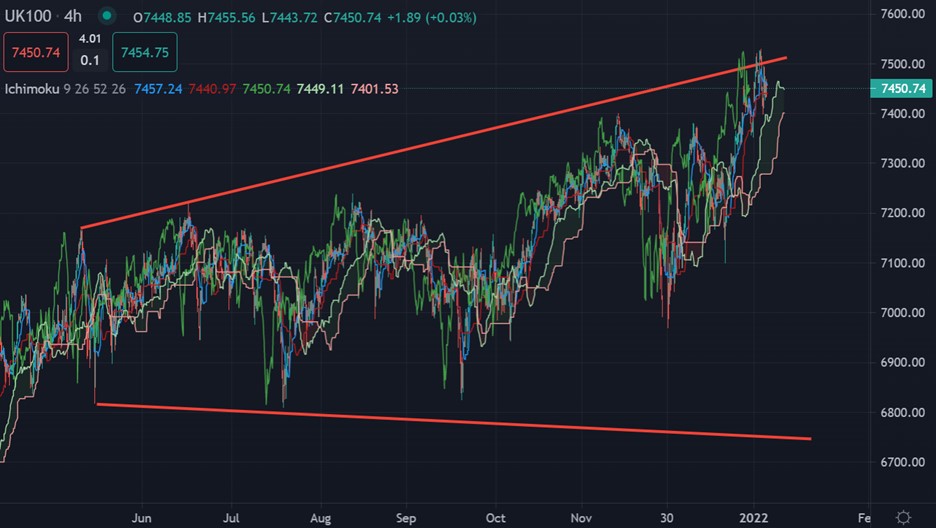
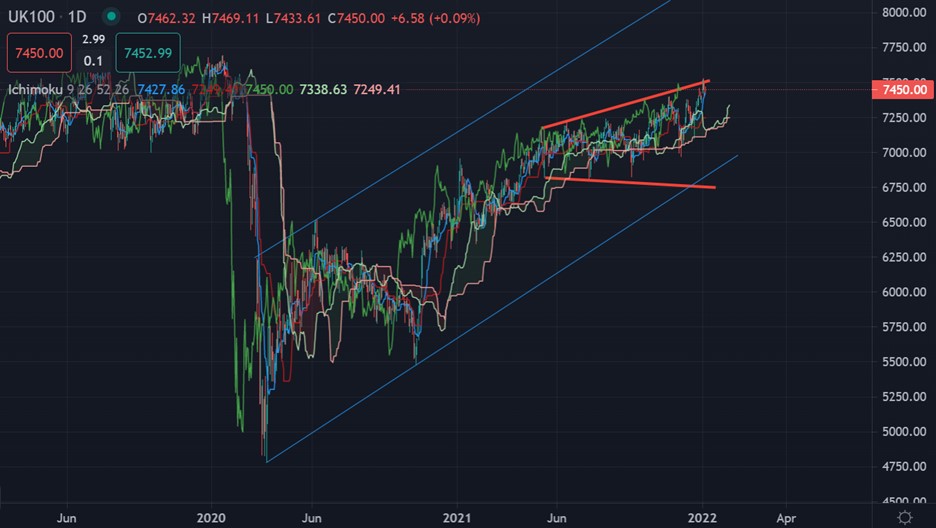
The FTSE 100 is starting to pullback from the trading highs of the week as the index struggle with the hugely technically important 7,500 resistance barrier, denoted by a huge trendline.
Earlier in the week a brief spike above the 7,500 level briefly took place, however, the spike quickly fizzled and the FTSE100 has started to settle in the 7,400 to 7,500 price range again.
From a fundamental perspective the FTSE100 index is vulnerable due to the FED taking away QE and raising rates, which could cause stocks to have mini meltdown by itself.
Moreover, rising inflation and a wage stagflation is likely to hurt the spending power of the average worker, which is likely to dent company profits if the consumer is starting to spend less.
I would make the argument that the FTSE100 is vulnerable to further pullbacks from the 7,500 level and is starting to look “toppy” and may soon pullback. I also think the market is underestimating the risks in the market.
Additionally, the markets mood could quickly turn if we see risks from China starting to elevate and more defaults, and with the current backdrop of Omicron and tapering being long from current levels is incredibly risky.
Sentiment towards the UK100 is starting to drop, which is a good sign for bears. According to the ActivTrader platform some 63 percent of traders are bearish towards the UK100.
This is a decrease in bearish sentiment of some 15% from earlier this week. Ideally we need to see bullish sentiment in order for a big correction to take hold.
UK100 Short-Term Technical Analysis
The four-hour time frame shows that the FTSE100 is struggling around the top of a major rising trendline, which is currently making a huge triangle type pattern.
Make no mistake, we are either going to see the FTSE100 suffer a big price rejection above or around the 7,500-resistance zone or a huge breakout to new high. I think the downside seems more plausible.
See real-time quotes provided by our partner.
UK100 Medium-Term Technical Analysis
The daily time frame shows that the FTSE100 is trading inside a large triangle pattern and also a large rising price channel, with the triangle neutral, and the channel being a bearish pattern.
A break above the triangle is likely to see the index moving towards the top of the rising price channel.
It should be noted that the top of the top of triangle pattern sits around the 7,500 level. If the top holds then a massive technical reversal could take place, with the 6,750 area the indicated pullback spot.
See real-time quotes provided by our partner.