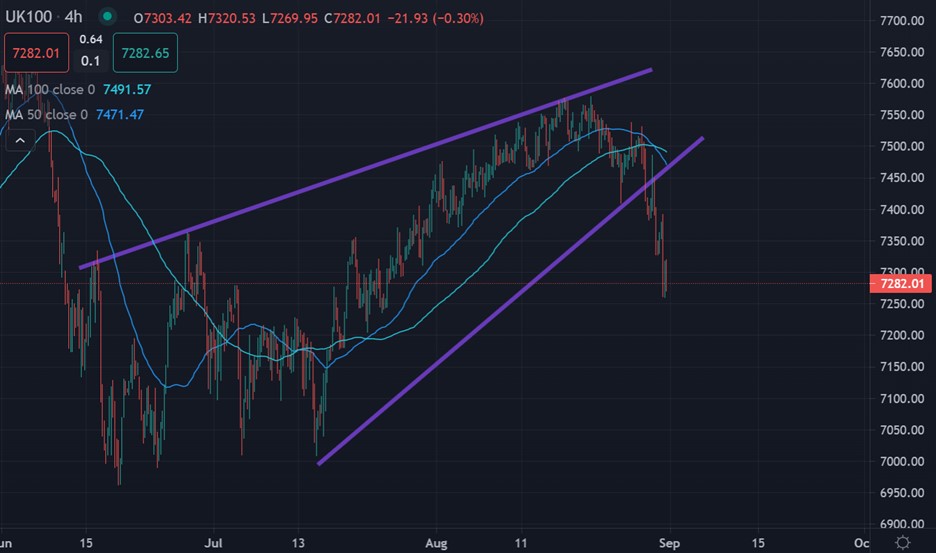
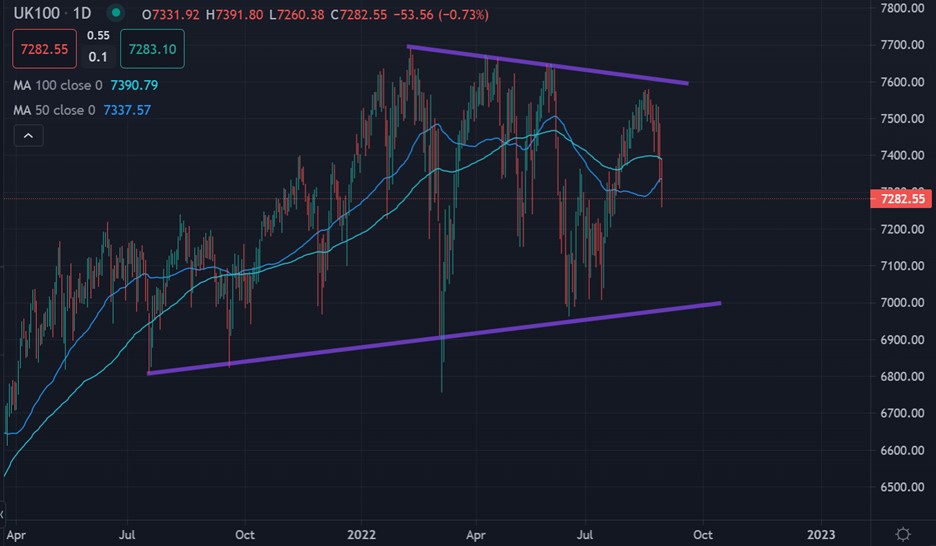
The FTSE 100 has been sliding hard over recent days as traders start to sell UK stocks in response to the coming action by central banks across the globe and the potential for economic hardship in the UK.
Much has been made of the cost-of-living crisis in the UK, which is set to accelerate over the coming months as the harsh winter in the UK is set to see energy price double for some households.
Meanwhile, the UK is also facing a political confidence crisis as outgoing PM Boris Johnson is set to be replaced by two equally unpopular candidates. In general, there is little reason to be bullish on the UK.
We have also seen the inverse correlation with the GBPUSD pair starting to break down. The pair is for all intents and purposes supposed to move in the opposite direction from the UK100.
However, both are trending down which would imply that the market does not care about a weaker sterling and the decline in the British pound and UK100 are a vote of no confidence against the UK economy.
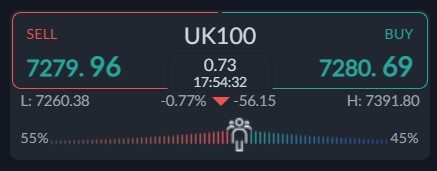
Sentiment has recently neutralized after offering a major warning that a price collapse could be coming. To many traders were long the UK100 and subsequently this flagged the previous price drop ahead of time.
In an ideal world sentiment should be heading in the opposite direction of the trade. This is because retail traders are normally on the wrong side of the trade, and especially price trends.


