Market Wrap
The major indices are down heavily today as the stock market collapse that we saw on Friday continues into this week’s trading. The Hang Seng, Nasdaq and CAC 40 are all down -3.81%, -2.98% and -2.75% respectively and show how global this selloff is. Every corner of the financial markets is being affected. It is not just the riskier assets like equities and commodities, it also includes the traditional havens of the precious metals too.


The forex heatmap is signalling the clearest indication of risk off, with the top right-hand corner solid green and the bottom left corner solid red. The weakest currency today has been the Australian dollar, closely followed by the Kiwi and Chinese yuan. The strongest currency relative to its peers is currently the yen as we trade into the London close. The bad news continues to come from the east of Ukraine, but we are seeing troubling moves in Chinese economic data, and we also must contend with further Chinese induced supply chain disruptions following their recent lockdowns.
See real-time quotes provided by our partner.
The AUDJPY on the H4 chart is forming a head & shoulders pattern which could break the neckline within the next sessions close, due to the precipitous fall from the recent swing highs. The chart pattern is not complete until a closing price below the neckline which is coming in just above the 90.00 level. I do not usually like to point these patterns out as they have a habit of trapping traders short and sweeping the stops above the right shoulder and head. However, as the AUDJPY has been in an exponential move higher since early February 2022, this could be a topping pattern.


We have the US CPI readings on Wednesday, but this afternoon we learned that the US inflation expectations are dropping. This sentiment indicator is a welcome turn and could lead the drop-in monthly rate of change in US inflation. The question is how will the market react to a slowdown in inflationary pressures or what will they do if inflation does not drop month on month? A lot of today’s moves could be coming on the back of market manoeuvring ahead of the CPI data drop.
See real-time quotes provided by our partner.
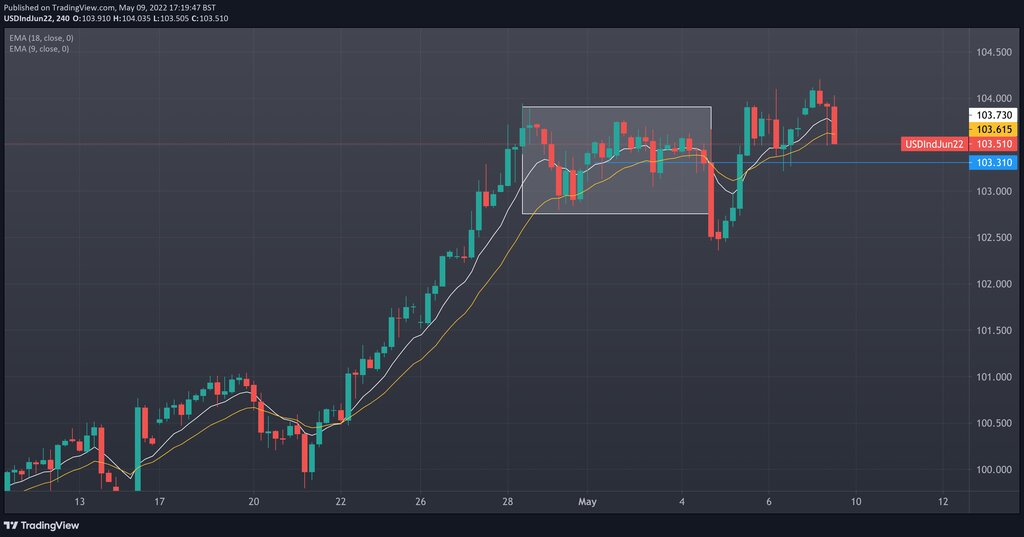
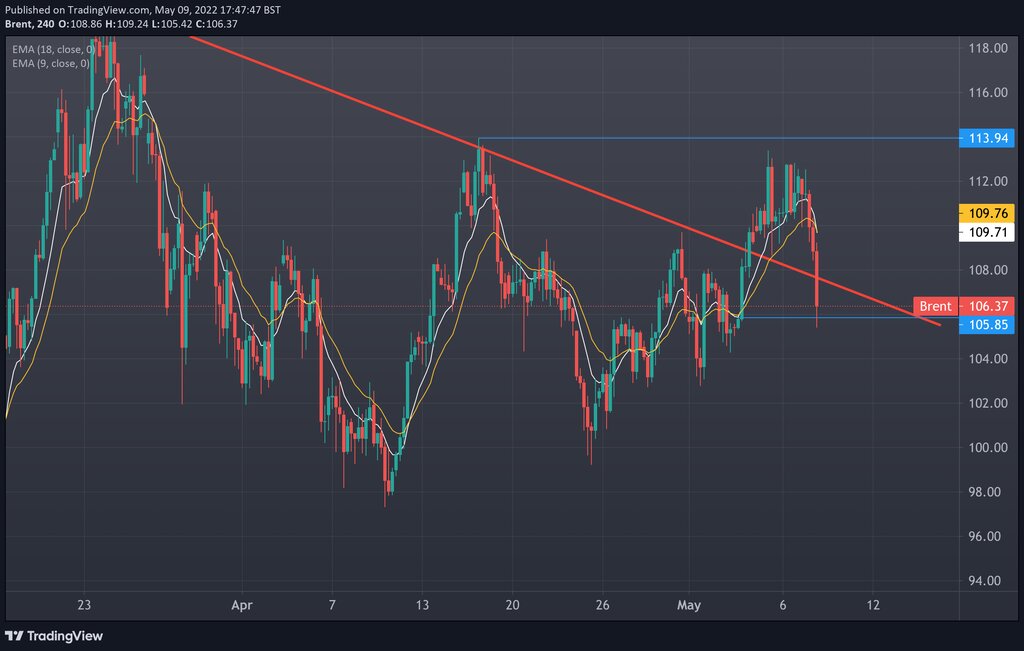
The US dollar gapped higher, filled that gap and is now looking like it trapped the long-positioned traders. What may actually be happening is a test of the range between the 28th of April and 5th of May. We have seen the liquidity below get tested, and now the liquidity above. If the mid-line of the white box holds, this will be my first indication that the bulls are still in control. If they remove the stops below the recent dip low, I will be looking for that market structure to hold as resistance and for a test lower in the coming days.


If long term inflation expectations are around 3% and the yields have pushed through that level of interest rate, we may see a pullback in the benchmark US rates. Especially with a drop in the rate of inflation this Wednesday. The result of such a move in CPI could lead to a decline in the benchmark yields, a drop in the US dollar and may be a bounce in US equities.
See real-time quotes provided by our partner.
The sharp decline today in Brent following the Chinese lockdowns as they try and get on top of the spreading COVID signalled to the energy speculators that there could be a demand shock. The price action though is still making higher highs and higher lows and if the $105.85 holds into today’s US close, this could have been a buy the dip moment as they shook out weak longs.