Weekly Index Analysis – S&P500
The S&P500 has been in an almighty uptrend for 14 months since the March 2020, COVID-19 market crash. There have been a couple of pullbacks along the way up to the all-time highs, most notably in September/October 2020, which proved to be a solid base for the ensuing rally.
Last week’s price action may have been a turning point in investor sentiment and with the commonly spoken phrase of “Sell in May and go away, and come on back on St. Leger’s Day”, we could well be seeing the profit taking investors packing up for the summer.


The resulting candlestick formation on the weekly chart can be describes as the ‘Hanging Man’. The hanging man candlestick pattern is valid when the asset has been in an extended uptrend. And is recognisable when the distance between the open and close, also known as the body, is shorter than the long lower shadow. Ideally there is little to no upper wick.
This particular candle stick indicates that buying pressure is diminishing and the likelihood of a reversal in greatly increased if new buyers do not step in and take price above the high.
See real-time quotes provided by our partner.
Another tell of impending reversals is when the ‘Hanging Man’ candlestick forms with higher-than-average volume, as can be seen on the ActivTrader chart for the USA500. The volume last week was the highest for the previous 8 weeks.
We have the FOMC meeting minutes released today and there will be a lot of focus on whether the Federal Reserve are even thinking of adjusting monetary policy due to the higher-than-expected CPI report this month. The likelihood is that they are not going to change based on one report and especially because the jobs data is not improving significantly.


The majority of the companies within the S&P500 had beaten analysts’ earnings expectations but with rising benchmark bond yields and a depreciating US dollar there has been a shift in the markets and a change in agenda or focus.
The infrastructure bill that President Biden is trying to get bi-partisan support for is still away off from becoming reality, and the talk of higher corporation & capital gains tax with big tech regulation, is starting to weigh on the future earnings potential of the largest components within the index.
See real-time quotes provided by our partner.
On the daily chart the reversal pattern with such a strong up trend would have been hard to take unless you just speculated on lower prices. The more conservative approach will be to jump in on a breakdown of the recent swing low if we get a daily close below 4050.00 and the 50-period exponential moving average.
The targets to the downside should the weekly ‘Hanging Man’ pattern playout will be to sub $4k prices, with the 161.8% fib extension coming in around $3900 and the 261.8% fib extension down by the 200 period ema and $3733.00 price level.
The retail investor is also having to navigate some Billionaires who have some high stakes bets on within the markets. Elon Musk has put a fire sale in motion within the Crypto community following tweets that Tesla will no longer be accepting Bitcoin for payment. But to add to the pain of the meme/crypto/hot money investors who look to Tesla as the future, they learned this week that the infamous ‘Big Short’ investor Michael Burry is betting against Tesla.
See real-time quotes provided by our partner.
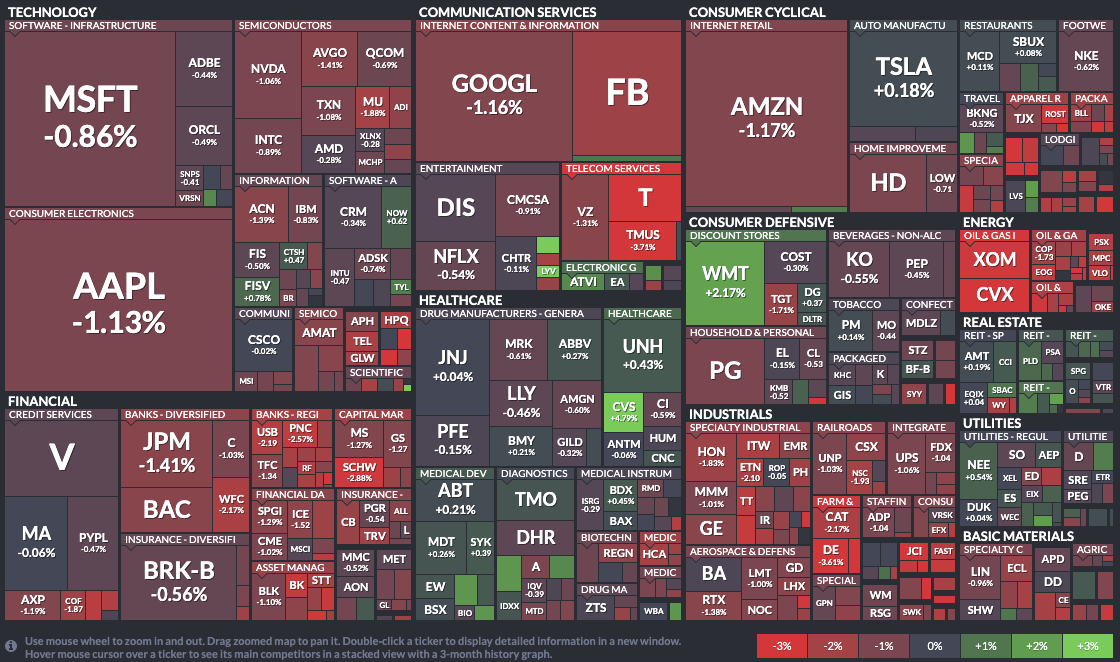
After Tesla’s earnings the due diligence began in earnest on whether or not the poster boy of Electronic Vehicles was really the emperor with no clothes.
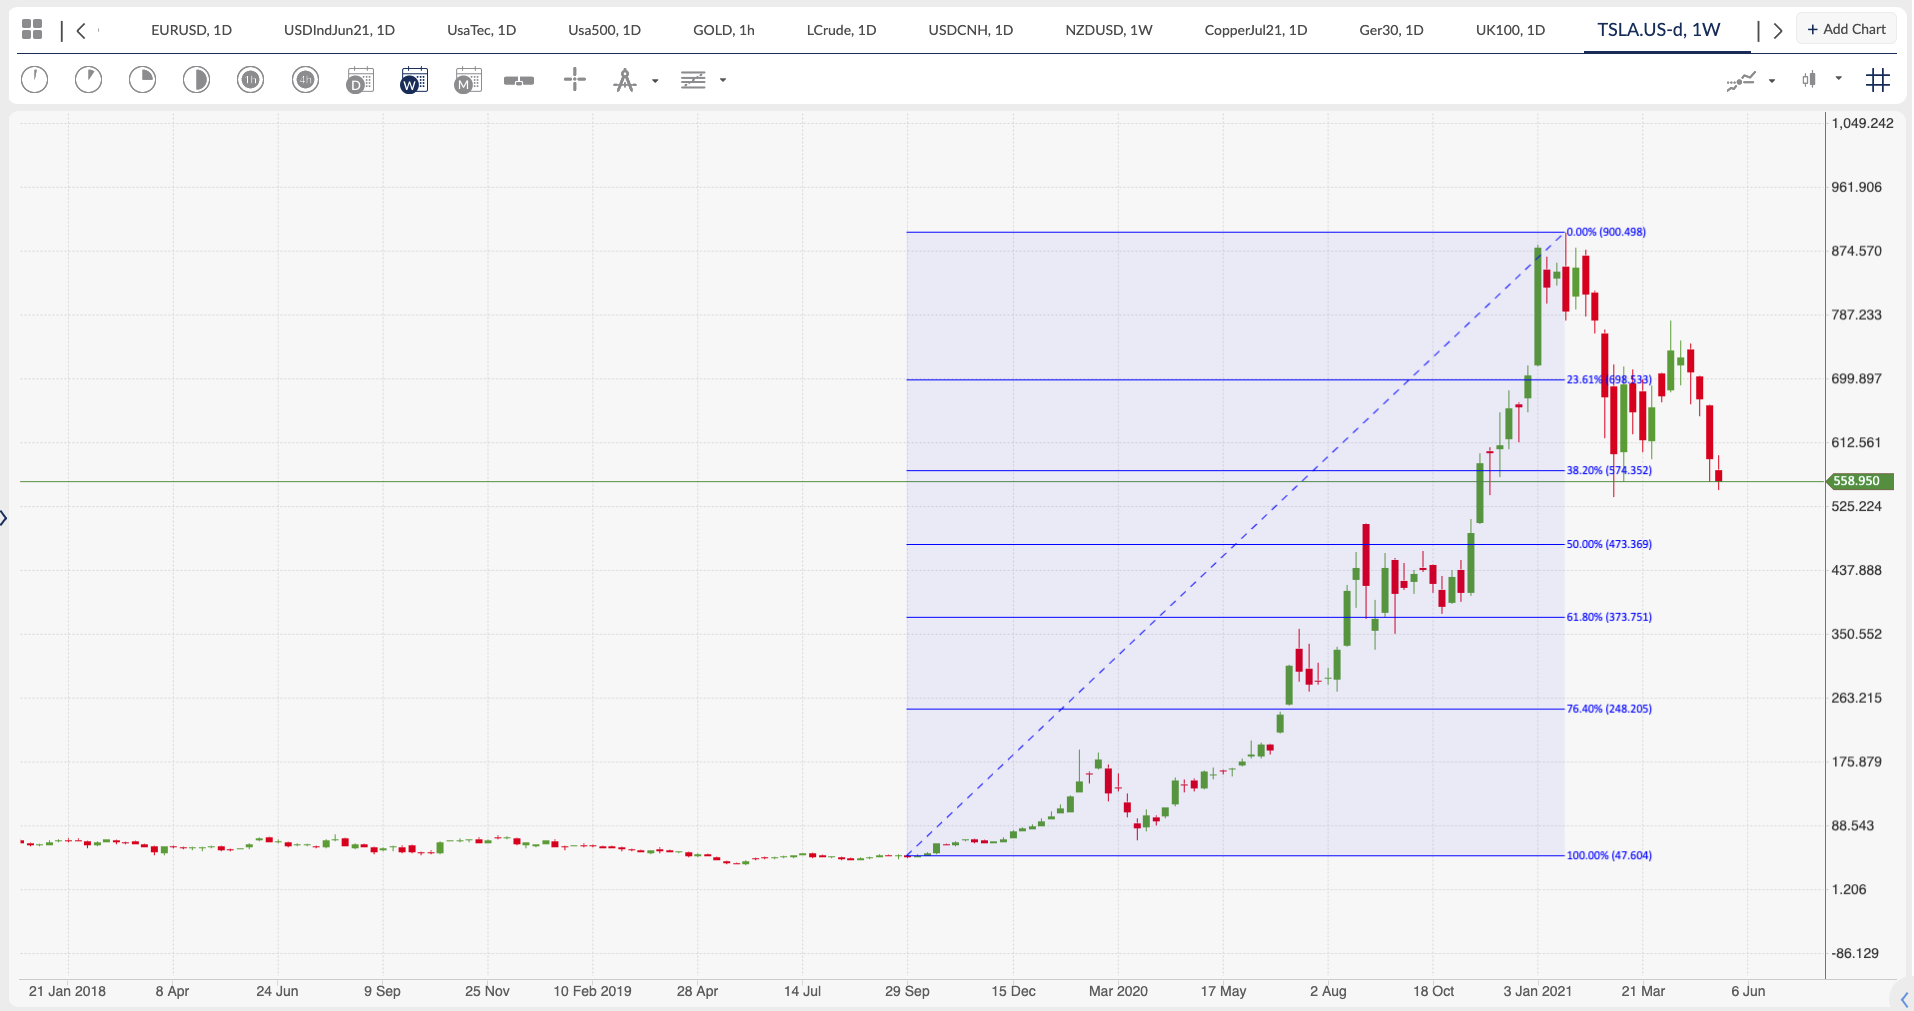
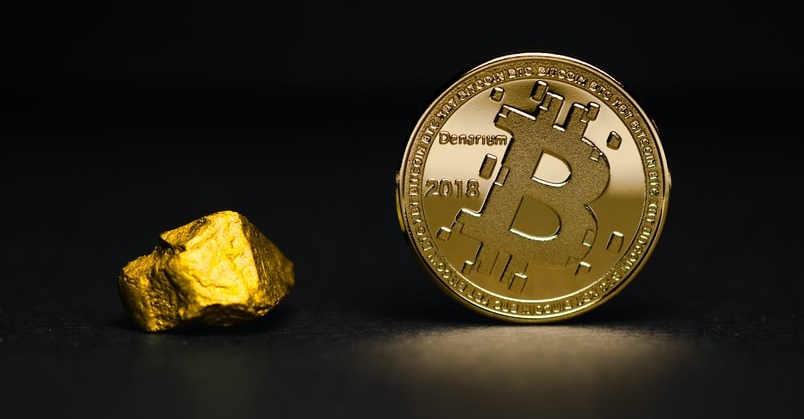
Tesla’s earnings reported that the company made more money with the sales of emissions credits than they did selling cars. When Bitcoin was on the move towards $60,000 the car company also sold $101mln of BTCUSD adding to the company’s revenue.
Tesla receives the regulatory credits for free for being a green company, and then sells the credits onto other car manufacturers who need the credits but do not necessarily sell enough or make enough EV’s. Tesla is bound to lose out on this lucrative cash stream as more of the incumbent vehicle manufacturers move to EV’s over the next decade.
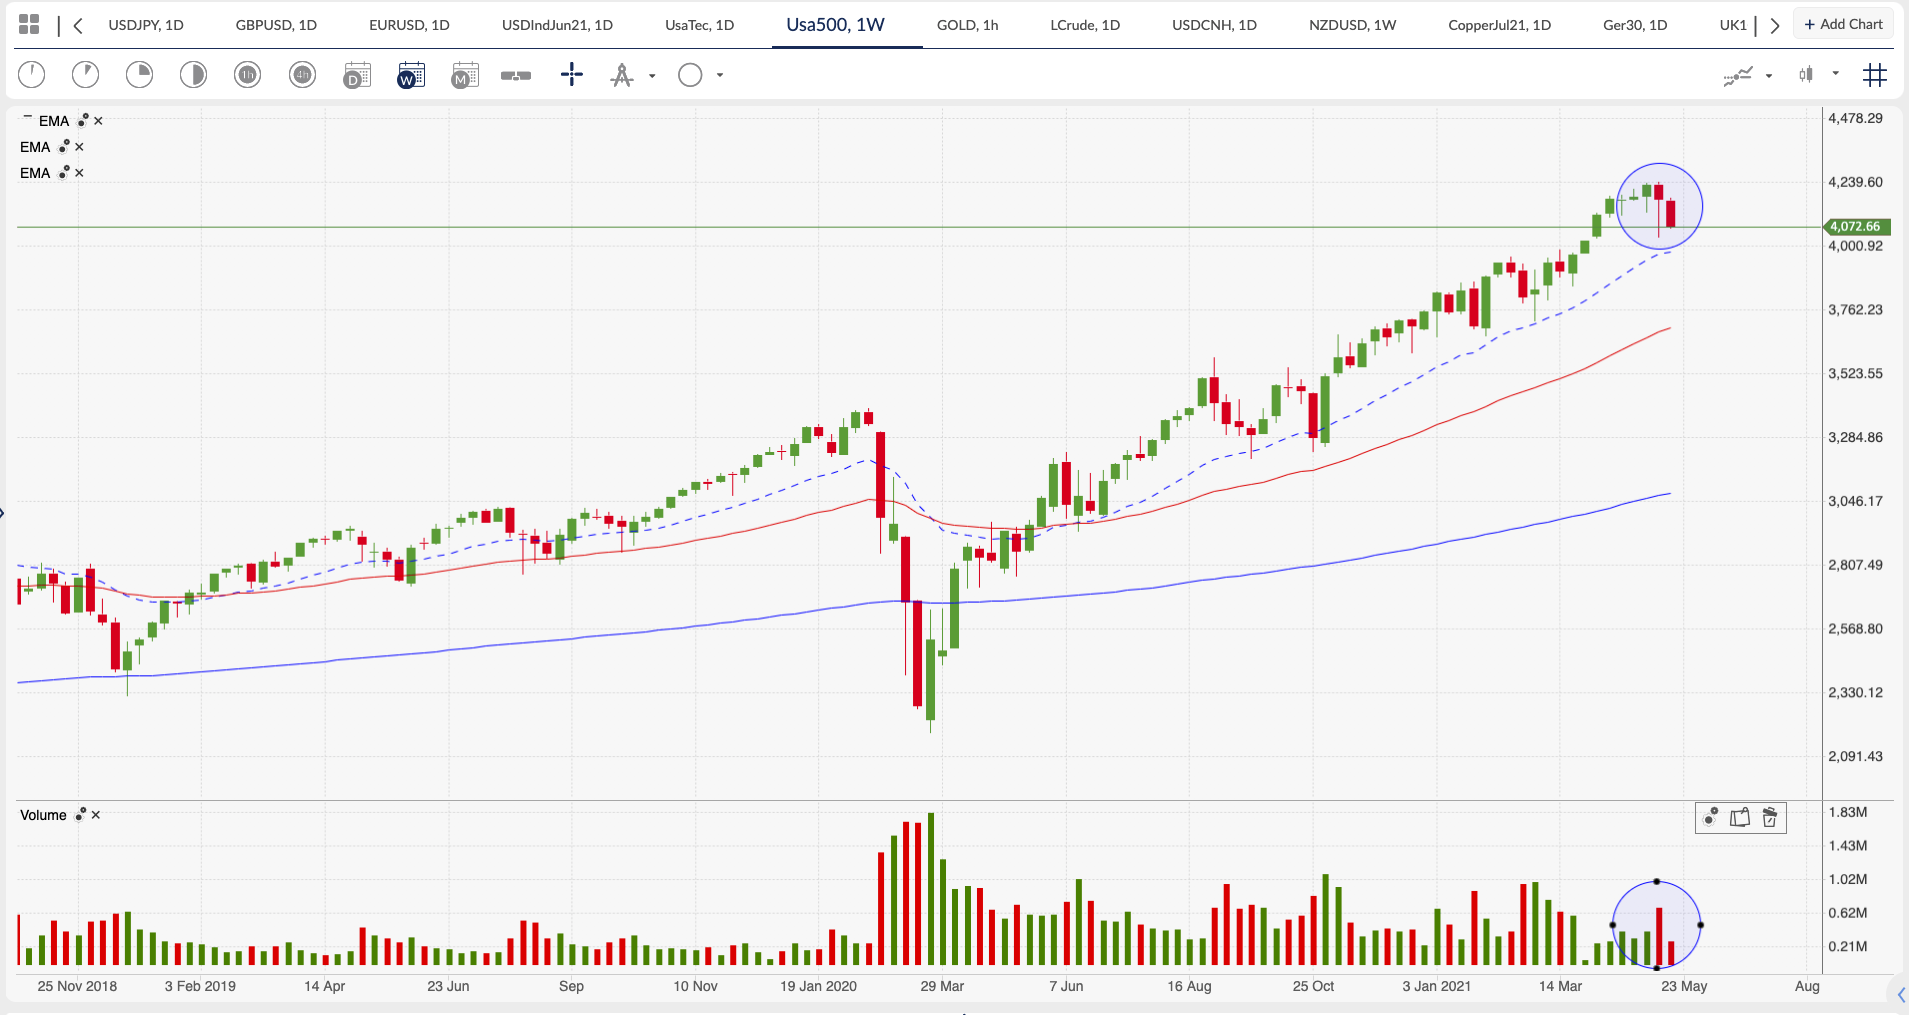
It is hard to bet against the S&P500 as it is designed to reflect the growth of the USA’s finest companies. With the COVID-19 vaccine rollout flattening the curve of infections and more states opening up, the US economy is bouncing back. Making this current correction in the S&P500 just that, rather than a market crash.
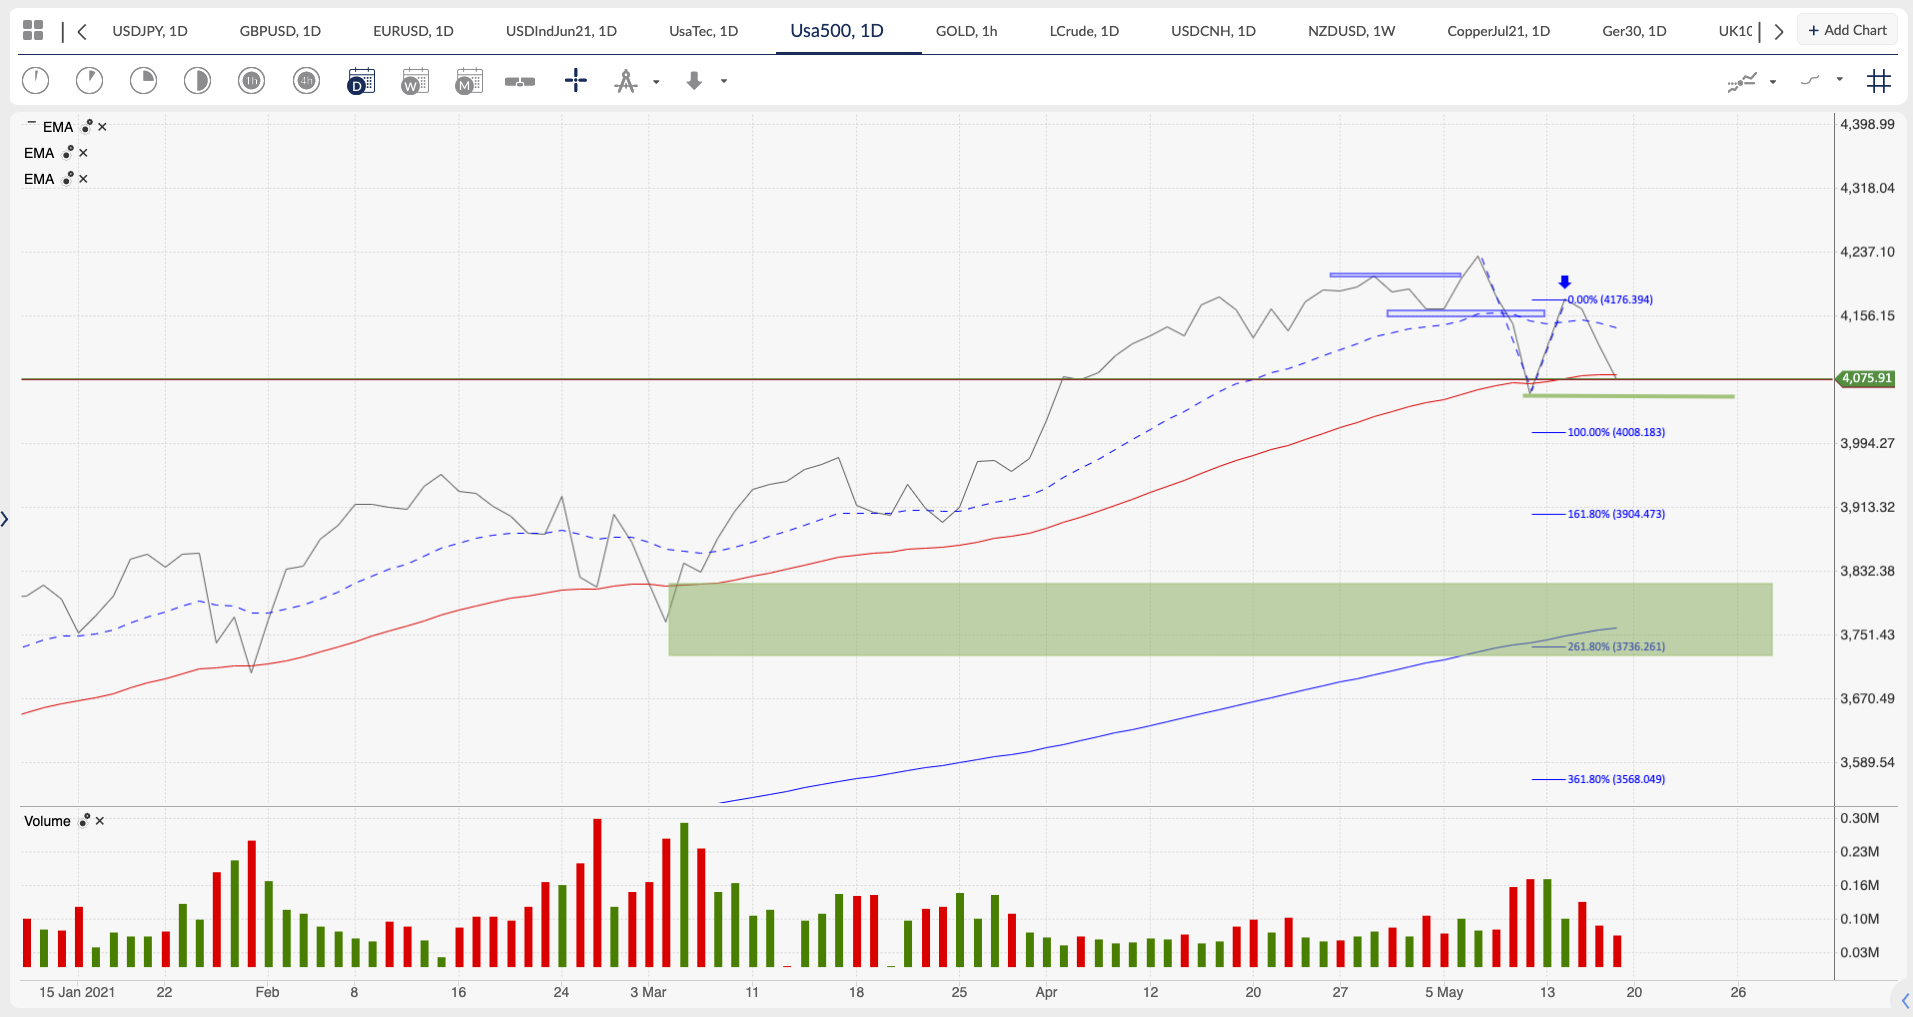
A stock market crash is when a market index drops severely in a day, or a few days, of trading. A stock market correction is when the market falls 10% from its 52-week high over days, weeks, or even months. A 10% correction would have the S&P500 trading to 3800, which if it happened over a few days to weeks, would mean that we would likely meet the daily 200 ema as support.
See real-time quotes provided by our partner.
Also, as corrections do not last very long it should be noted that Gold can be a great portfolio hedge during uncertain times. A study done by researchers at Trinity College in Ireland, found that, for 15 days after a crash, gold prices increased dramatically. We have seen the price of gold moving higher on the back of a weaker US dollar but rebalancing within a portfolio after earnings season could also be a reason, along with investors looking to risk adjust their returns by holding some precious metals whilst hedging against inflation too.
The key take away should be the trend is your friend, until the bend in the end. We may be seeing that bend now. But remember, do not fight the Fed either, so probably best to take head to what they say tonight and position accordingly if nothing materially changes to their monetary policy.