The S&P 500 has tumbled sharply lower and turned negative on the year so far after the FOMC meeting minutes revealed a much-more hawkish stance from FED policy makers.
According to the FOMC minutes, “many participants judged that the appropriate pace of balance sheet runoff would likely be faster than it was during the previous normalization episode”.
The market reaction immediately saw US stocks falling, bond yields surging, and the US dollar currency starting to strengthen as traders flocked back into the buck. This was indeed a hawkish reaction.
Other key takeaways from the Minutes were the balance sheet and tapering speed. The FED said, “many participants also judged that monthly caps on the runoff of securities could help ensure that the pace of runoff would be measured and predictable”.
Additionally, the Minutes showed “participants noted that the current size of the balance sheet is elevated and would likely remain so for some time after the process of normalizing the balance sheet was underway.”
Fund flows into the index were quite significant at the start of the year, despite the S&P 500 lagging the DJIA and the NASDAQ. However, these funds may look to enter back into the market at lower levels if the selling starts to pick-up again.
In terms of negative price catalysts, no new US stimulus, worsening global consumption, and the potential for more COVID-19 restrictions over the coming months are all likely to create solid headwinds for the index.
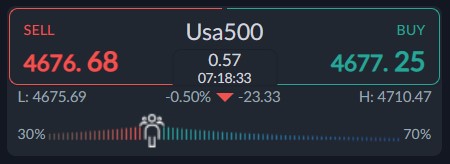
Something else to consider is market sentiment. That ActivTrader sentiment platform shows that nearly 70 percent of traders are bullish towards this market. I believe this is negative because the near-term fundamentals and technicals are quite worrying.


