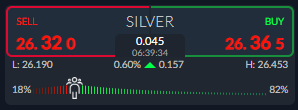
The price of silver is starting to consolidate around the $26.00 level after the Federal Open Market Committee policy decision showed that the United States central bank were in no hurry to change monetary policy and taper QE.
Precious metals have attempted to rally once again, as traders and investors factor in more of the same for the coming weeks ahead. Fiscal spending from the Biden administration and upcoming US data are likely going to be the next market mover for precious metals.
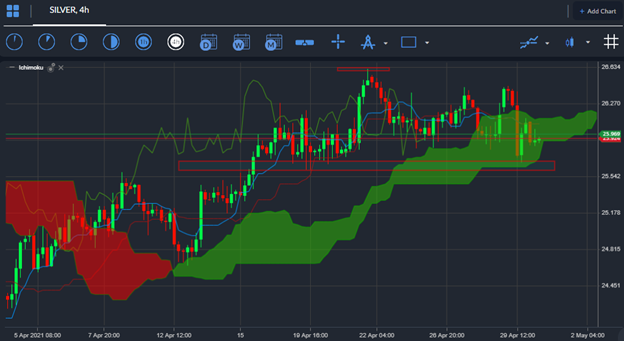
Silver’s technical outlook look very bullish in the short to medium-term horizon. The metal has been gradually recovering from the $24.00 level over recent weeks and appears to be forming a complex inverted head and shoulders pattern.
Buying price dips below the $26.00 level appears to be the best strategy when attempting to play these type of price patterns. This pattern in particular are projecting that the price of silver could be about to rally towards the $28.50 area.
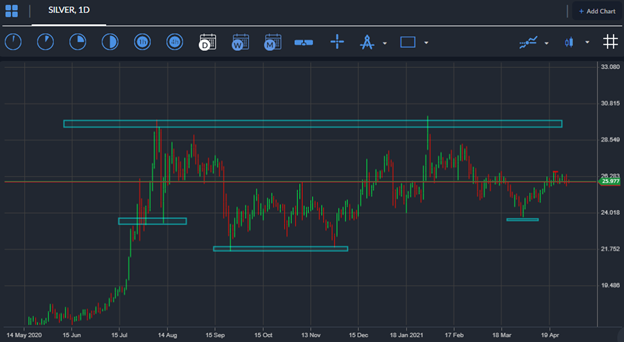
Technical traders will remember the main battle for silver bulls have been having is with the $30.00 level. This is by far the most interesting technical level on silver’s price chart right now, and one that silver has failed to conquer on two consecutive occasions after the last twelve months.
The technicals clearly show that the price of silver could go parabolic if it crosses the $30.00 benchmark level due to the presence of numerous bullish price patterns located on the higher time frames.
According to the ActivTrader Market Sentiment tool traders are still overly bullish towards the price of silver, with some 82 percent of traders expecting more gains in the price silver.


