Commodity Analysis
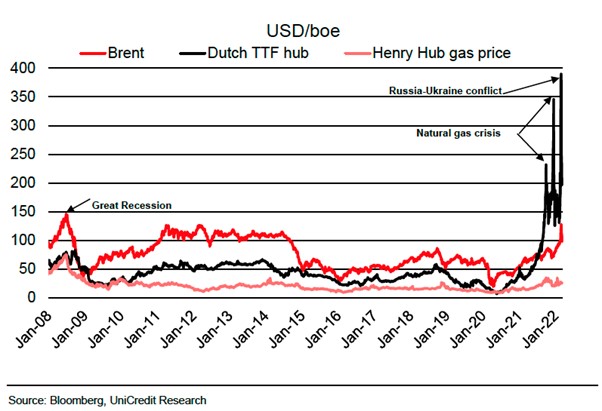
Vitol is a leading independent trader in crude oil and associated products with a global physical operation and they know a thing or two about the flows of energy worldwide. Their CEO today said that the company is observing some oil demand destruction and that the oil market will find it difficult to manage the disruptions to Russian oil. In his speech to the FT Commodities Global Summit, he made the point of saying that the gas markets were of greater concern than the oil markets. This was reiterated by the CEO of Gunvor, another global commodity trading house, who said the natural gas market is broken and in particular, the Dutch TTF.
From the summit we can ascertain that the markets are expecting a Russian oil production cut and with the added volatility in the markets it has become too expensive to hedge certain positions, so they are having to back away from the deals. The European Union has confessed to being too reliant on the Russians for energy but a transition away from this supply would take between 5 – 10 years. Of the reduction in Russian oil, exports may be totalling just over 2 million barrels per day, half of that could be replaced by Iranian oil if the nuclear deal could be signed off.
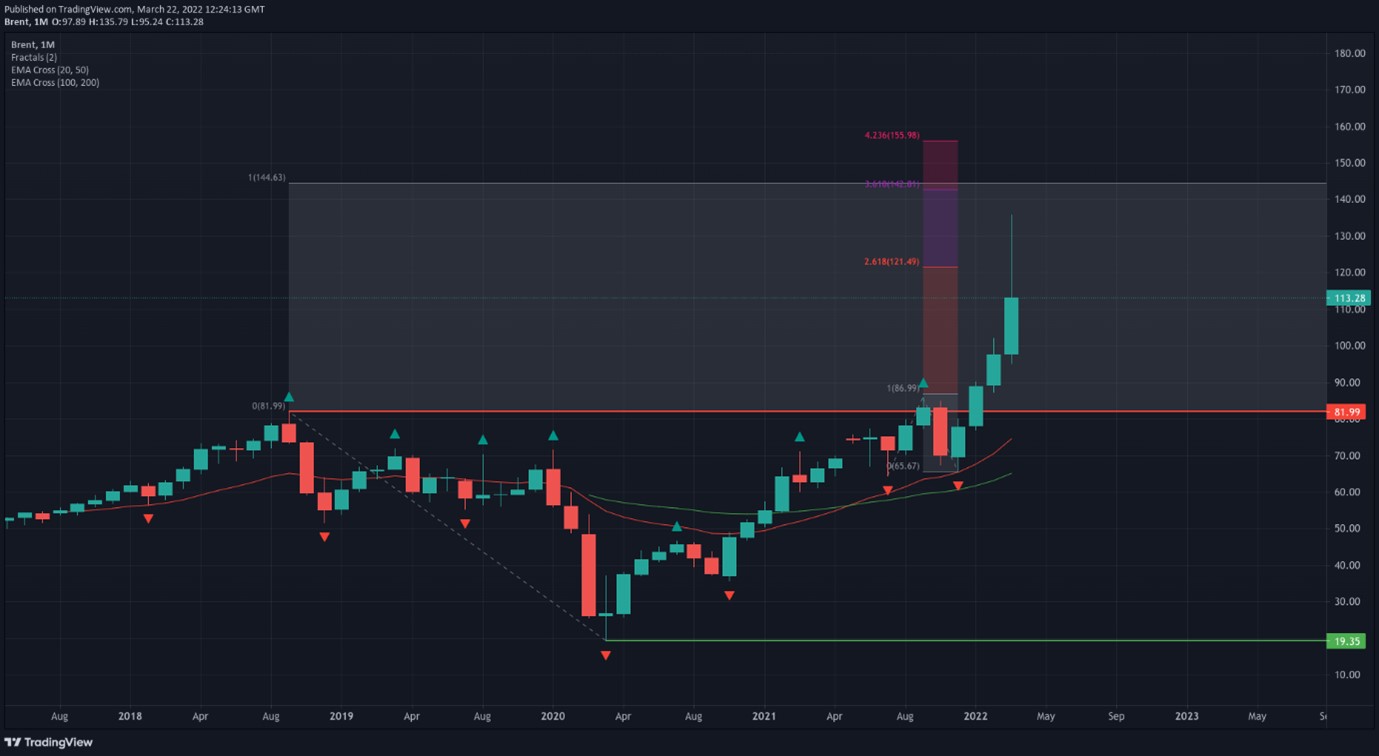
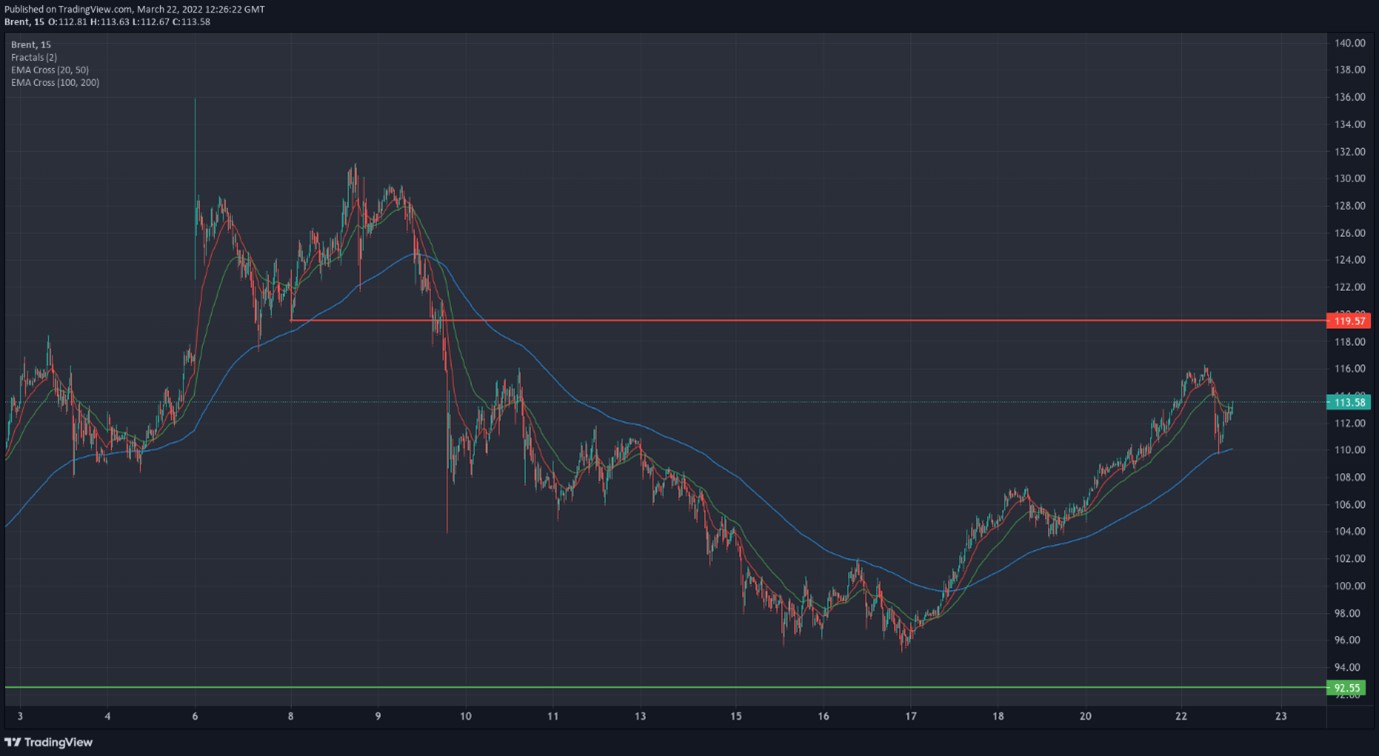
Investment bank Goldman Sachs has adjusted their Brent forecast for 2Q22 to $120 the 2H22 forecast unchanged at $135, based on a recovery in the Chinese demand assuming they get through these latest waves of covid disruptions. GS’s forecast for 2023 is for a modest drop to $110 on the basis that output will come from higher shale production in the US.
See real-time quotes provided by our partner.
The monthly chart for Brent shows that $130 per barrel was the limit in the shock of the Russian invasion of Ukraine. Energy prices up until that moment in February had been gradually moving higher, adding upward inflationary pressures, and causing central banks to change their monetary policy. March’s price action has now come back down over 50% from the highs but the grey box illustrates the measured move of the breakout from the 2018-2020 range. If China gets back on its feet and can absorb the remaining cheap Russian oil, there may become a global shortage in the coming year or so. OPEC+ is already struggling to meet quotas and the UAE has been the single voice willing to raise production quicker. Price action and momentum would suggest that we test above $130 in the coming months but there is a technical case for a test of the $82 level first.
See real-time quotes provided by our partner.
The other macroeconomic developments were between the Saudis and China who are looking to strengthen ties. There was a suggestion that the Saudis could start excepting Yuan in exchange for their oil, rather than going with the petrodollar pricing. If it were to be a case of accepting both, analysts believe the volatility would increase and it would be worse for the Saudis. However, long term the Chinese are most likely to be the preferential buyers and therefore are worth investing effort into.
The USA is energy independent, and the Europeans are moving away from oil to reduce carbon emissions. Saudi Arabia also has a plan to transition away from oil and by 2030 would hope to have a more diversified economy. The Chinese of course would like to keep their Belt and Road initiative on track. When it comes to which currency wins in international trade, it comes down to economic and political factors. Russia and a lot of other countries are willing to de-dollar their foreign reserves due to the weaponization of the US dollar through sanctions. Since January 2019, Saudi Arabia has grown its exports of petroleum and related products by 17% year over year to China. This reflects the surge in oil prices as well as a rising share of Saudi oil exports to China. Imports from China have also risen sharply over the past year, increasing by an average of 13% year over year. As a result, China’s share of trade with Saudi Arabia has risen from 14% to over 19% as of today.
Forex traders would have noticed that the USDCNH became unpegged in August 2021 as the PBOC made a concerted effort to keep the offshore Renminbi strong.
See real-time quotes provided by our partner.
With daily momentum currently expressed through the EMAs as bullish, the question for price action traders was the recent fall from the highs a correction or a shift in direction. This question would be answered with a reaction to the breakdown level of $119.57 as a clear rejection of that level would in my opinion signal sellers were waiting there and this time, they are going to drive the market back down towards the $80 level. Buying the dips around the EMAs has also proven to be quite a successful strategy and anyone that bought the 50 EMA is sitting on a nice profit now with the $142 level in their sights.
See real-time quotes provided by our partner.
A further push-up in oil would see the Canadian dollar appreciate and we could be about to see the USDCAD come through some significant market structure. A close below 1.25530 and traders will try and hold for the 1.2350-1.2300 zone.
What I am very mindful of though is that the ActivTrader sentiment indicator says that 92% of traders in Brent are looking for higher prices. This means that I should be looking for a reason in the fundamentals, and news headlines to get short. A let-up in fighting in Ukraine would be the first signal to get short. Higher production from the USA and possibly the Middle East would be another. Significant demand destruction the third.
See real-time quotes provided by our partner.
For the day traders, there has been of recent times a great signal on the m15 chart when price touches the 200-period EMA. But again the recent dip to the 200-period EMA on this time frame looked very bearish and now we’re waiting to see if the $116 level can hold or whether the bears are going to press on and push through the dynamic support and target the intraday double bottom around $96 which printed last week.