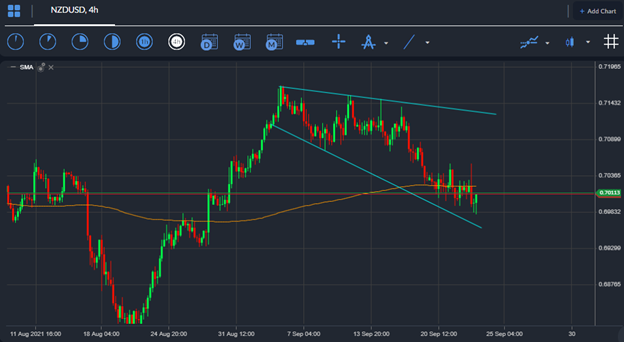
The New Zealand dollar has been slowly moving lower against the US dollar currency as the pairs recent promising run towards the 0.7200 price area well and truly starts to unwind.
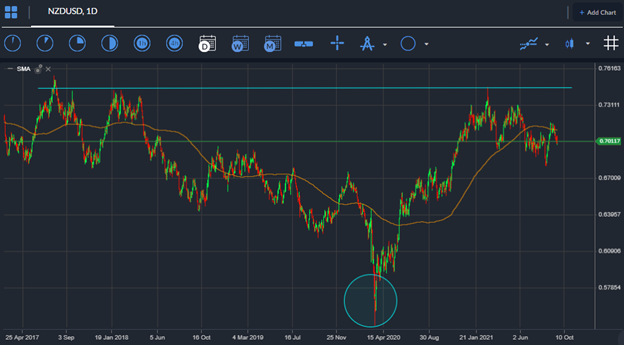
Dip-buyers may be rewarded for their courage here, as the charts clearly show that the 0.7000 area is a potential buy swing zone for NZDUSD bulls that are still expecting higher prices.
Moreover, higher and lower time frame analysis is littered with bullish price pattern that depict more upside the NZDUSD pair is more likely than not while the price holds above the August low.
In the near-term, a number of negative factors are weighing on the New Zealand currency. RBNZ Assistant Governor Christian Hawksby backed the central bank’s decision to delay the rate hike during the latest meeting, which is a negative for the NZDUSD pair.
Also underpinning the pairs weakness is downbeat New Zealand GDT Price Index data. China’s return after a notable absence due to an extended holiday is another risk factor as Beijing-based traders react to the Evergrande fears, which the NZDUSD pair being sensitive to Asian market moves.
On the positive front, the PBOC meeting was seen as being positive, while another factor for risk-on trades was hopes of further US stimulus, as hinted by House Speaker Nancy Pelosi, as well as the US Democratic Party’s push to suspend the debt ceiling.
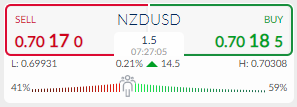
According to the ActivTrader market sentiment tool some 41 percent of traders are bearish towards the NZDUSD pair. As we typically look to fade sentiment biases, this could now may not be the time to buy the NZDUSD pair, as high levels of negative sentiment would be required for a classic contrarian sentiment trade.


