The New Zealand dollar is under pressure against the US dollar on the foreign exchange market as traders pay more attention to the Federal Reserve policy meeting outcome than the recent strong GDP data from the New Zealand economy.
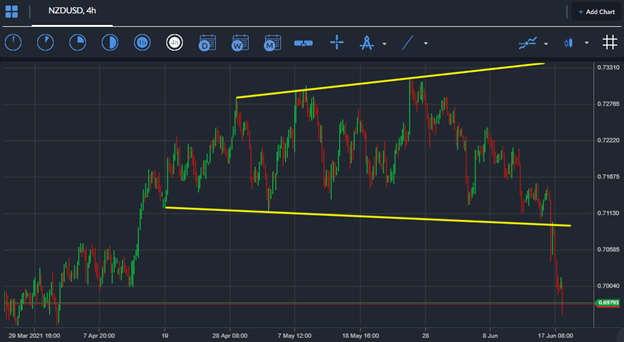
A breakdown in the NZDUSD pair is currently underway from a massive broadening wedge pattern, despite recent GDP data which showed that the New Zealand economy grew much faster in the first quarter than economists had been expecting.
Inside the data a clear case was made for an improving domestic outlook, as a rebound in construction activity and robust domestic spending helped to offset dwindling tourism revenues.
New Zealand Gross Domestic Product rose 1.6 percent during the first three months of 2021, which far exceeded most experts forecasts of 0.5 percent. Traders and investors have swept aside the notion that the RBNZ may tighter sooner than previously expected.
Digging into the technicals, the NZDUSD pair is heavily bearish in the short-term while trading below the 0.7090 level, while the overall bullish trend in the pair now eroded and only intact while the price trades above the 0.7035 level.
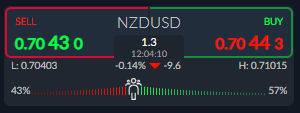
On the sentiment front traders have a slight bullish towards the New Zealand dollar right now. According to the ActivTrader market sentiment tool some 57 percent of traders are bullish towards the NZDUSD pair. Considering that the pair is now bearish in the short-term I tend to think more losses are likely coming.