The New Zealand dollar has been confounding currency traders, as the antipodean currency fails to rally against the US dollar, despite the RBNZ raising interest rates earlier this week.
Most traders would assume that the rate hike, which is significant, due it being the first-rate increase from a major central bank, would have a big impact on NZDUSD pricing. However, this does not mean an eventual rally cannot take hold.
The Reserve Bank of New Zealand’s Monetary Policy Committee raised its Official Cash Rate from 0.25% to 0.5% at its meeting today, delivering the hike expected at the August meeting that was postponed due the NZ’s COVID-19 outbreak.
In its decision today the Bank signalled that further removal of monetary policy stimulus is expected over time, contingent on the medium-term outlook for inflation and employment.
The fact that the RBNZ is cutting back on QE, and raising rates makes the NZDUSD pair a prime candidate to rally. We now need to see the FOMC play its card during the next policy setting meeting. A clear divergence between the central banks could cause the NZDUSD pair to surge.
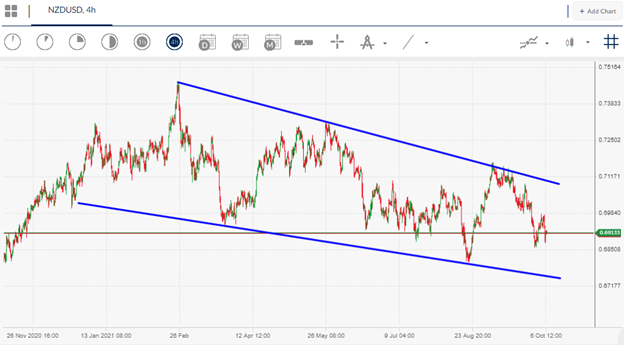
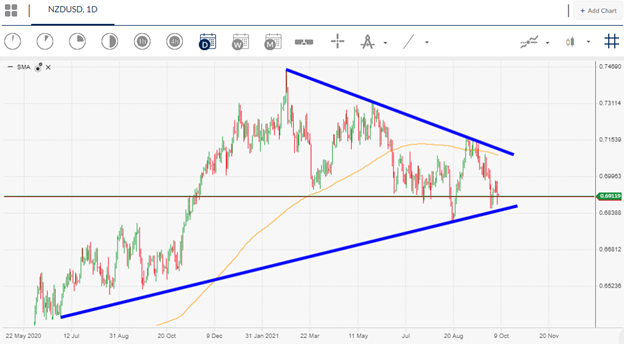
On the technical front, a big move is brewing. Not only are the Bollinger Bands narrowing, a classic sign of coming price volatility, but a massive triangle pattern break is nearing
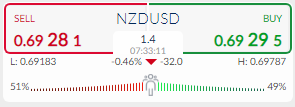
According to the ActivTrader market sentiment tool some 51 percent of traders are bearish towards the NZDUSD pair. As we typically look to fade sentiment biases, this could mean now is not the time to take a position in the NZDUSD pair. High levels of negative sentiment would be required for a classic contrarian sentiment trade.


