Index Analysis
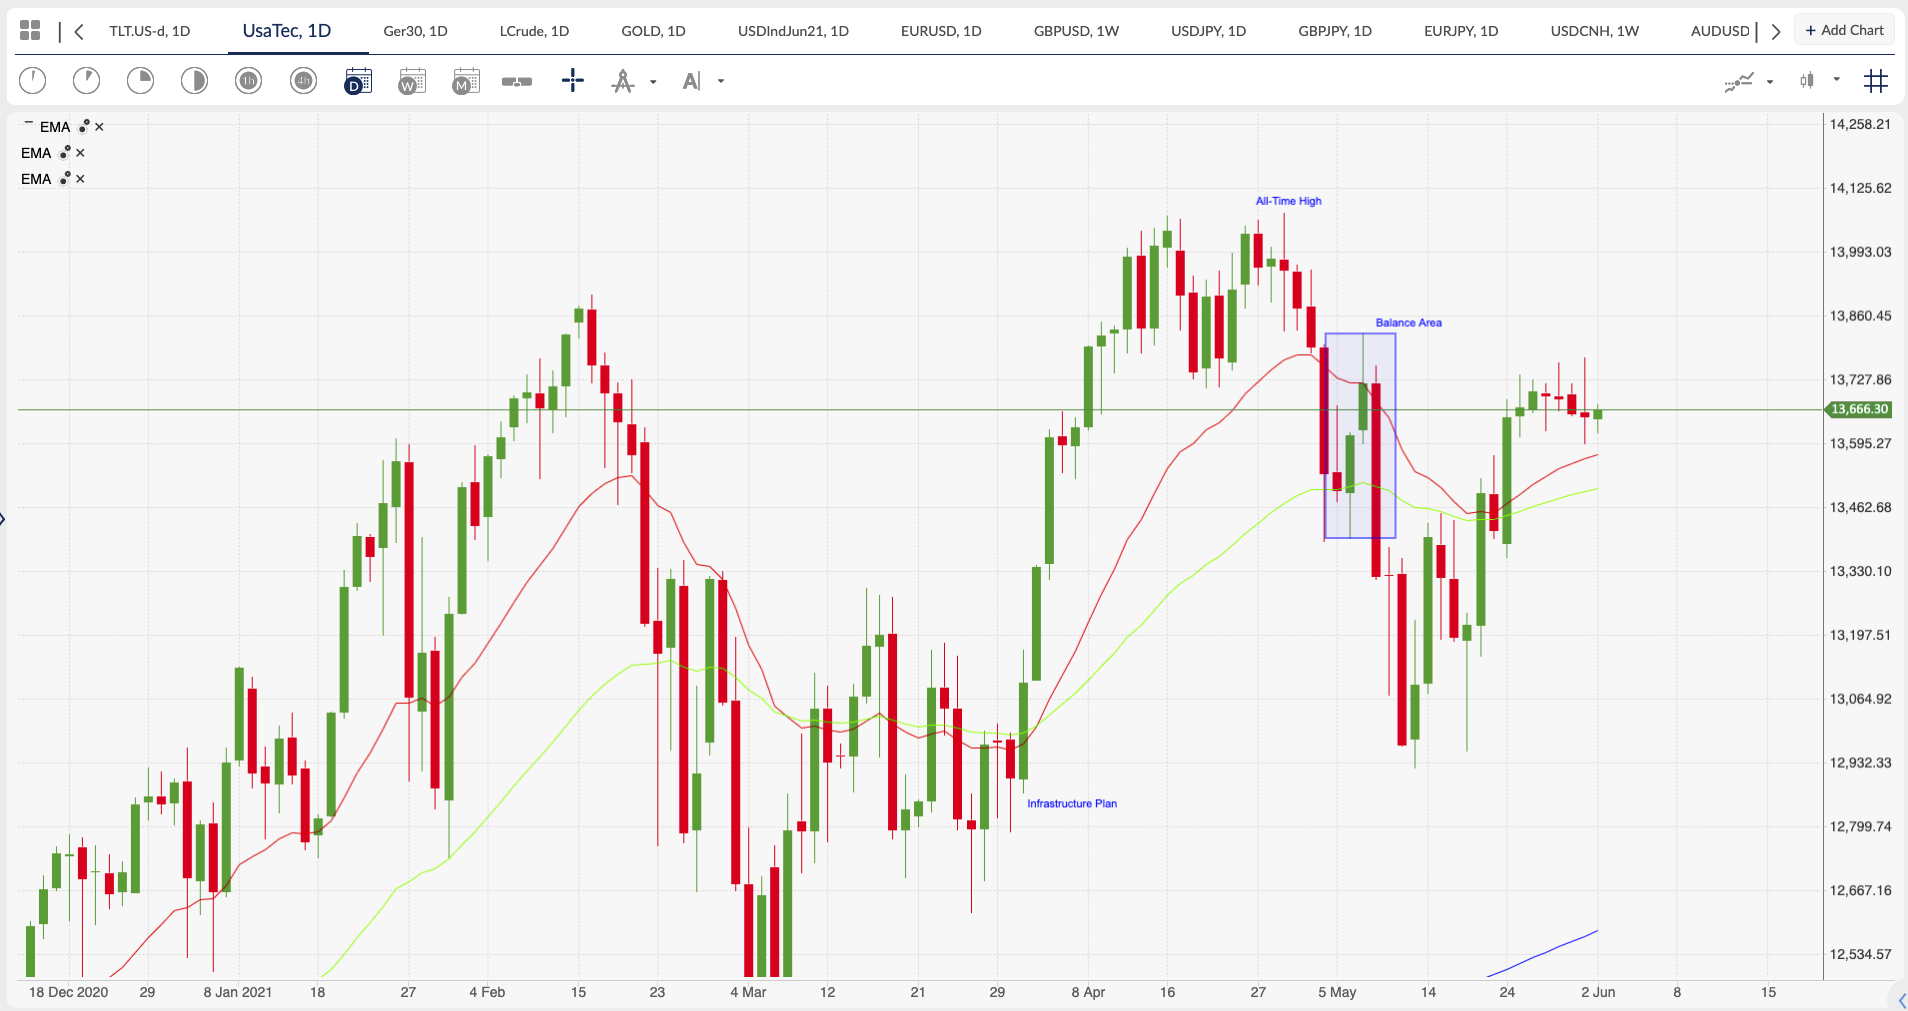
In March, this year President Biden set out plans to build back Americas infrastructure. That bill is currently being kicked around congress and the senate as they try and come up with a bi-partisan deal to get the bill passed.
In the initial statement released on March 31, 2021, it states that “The United States of America is the wealthiest country in the world, yet we rank 13th when it comes to the overall quality of our infrastructure.” Over the course of several decades each administration has neglected to update the roads, bridges and water systems. The pandemic focused the minds of the people and the politicians and getting the USA back to being great again is still on the agenda.
When the bill gets passed the key objectives are to fix highways, rebuild bridges, upgrade ports, airports and transit systems. Deliver clean drinking water, a renewed electric grid, and high-speed broadband to all Americans. Build, preserve, and retrofit more than two million homes and commercial buildings, modernize our nation’s schools and childcare facilities, and upgrade veterans’ hospitals and federal buildings. Revitalize manufacturing, secure U.S. supply chains, invest in R&D, and train Americans for the jobs of the future. Create good-quality jobs that pay prevailing wages in safe and healthy workplaces while ensuring workers have a free and fair choice to organize, join a union, and bargain collectively with their employers. The ambitious $2 trillion plan was to be part paid for by higher taxes on the rich and currently there is a growing consensus to get multi-national companies paying a globally aligned corporation tax. As the two sides of the political spectrum battle it out the amount of money being talked about reduces.
See real-time quotes provided by our partner.
On March 31, 2021, the Nasdaq started to ascend towards all-time highs having a solid base at 13,000, after being sold since mid-February on inflation fears, only to see the price action return to those same prices by the May 13, 2021.
The current price action is more than halfway back from the all-time high of 14,075 and the support at 13,000 and is still above the 3 daily exponential moving averages that we have been monitoring. The 20 is above the 50 and both are looking upwards, while quite a way below around 12,500 the 200 ema slowly keeps pushing higher with no sign of flattening off just yet.
If we look left along the chart from today’s prices, we see that the recent trading range is within a substantial balance area which formed at the beginning of May 2021, which if we were to push above 13,824, would then open up the big figure, ATH’s and beyond.
Bullish Technical Analysis
See real-time quotes provided by our partner.
If we go with the overall trend the higher time frames say the Nasdaq is currently Bullish, as the momentum is to the upside as seen in the moving averages and the price action is indicating higher swing highs and higher swing lows. All the way from the Monthly down to the Daily time frames.
On an H4 chart it is easy to see a recent double bottom at the lows which acted as a good base for support. As price rose from the 13,000 level it did a classic pattern of Breakout from the trading range, to Retest that level before Continuing higher, until it found enough resistance again to form this consolidation sideways range pattern.
If you are bullish the Nasdaq, you have probably labelled that consolidation as a Bull Flag, and anyone looking to get in on a long trade should either buy the base of the flag or wait for a breakout retest and continuation of that range.
The Bearish Idea
If, however you are of the mind that inflation fears have not dissipated enough, or the employment figures are not conducive to an improving economy, or maybe you are concerned about the number of states withdrawing the direct fiscal aide that so many Americans have needed, you may be thinking “The Trend Is Your Friend, Until The Bend At The End”. And that bend maybe occurring now!
After yesterday’s upthrust we could be now entering what Richard Wycoff would perhaps call Phase D, with the follow Phase E being the point in which prices fall out of the range.
See real-time quotes provided by our partner.
On the H1 chart the circled upthrust would be the highest print until we test the levels marked down to 13,210. After the H4 double bottom price action, the next few days were super bullish and in-between the US session closes and next day’s openings the price levels were not retested. On the US only, cash charts there are gaps, which if the last 5 months price action means anything, I fully expect these areas to get filled.