Market Wrap
In a recent interview with legendary trader Paul Tudor Jones, the veteran money manager said as of now, that he would not own stocks or bonds and at this juncture, capital preservation is more important now than ever.
See real-time quotes provided by our partner.
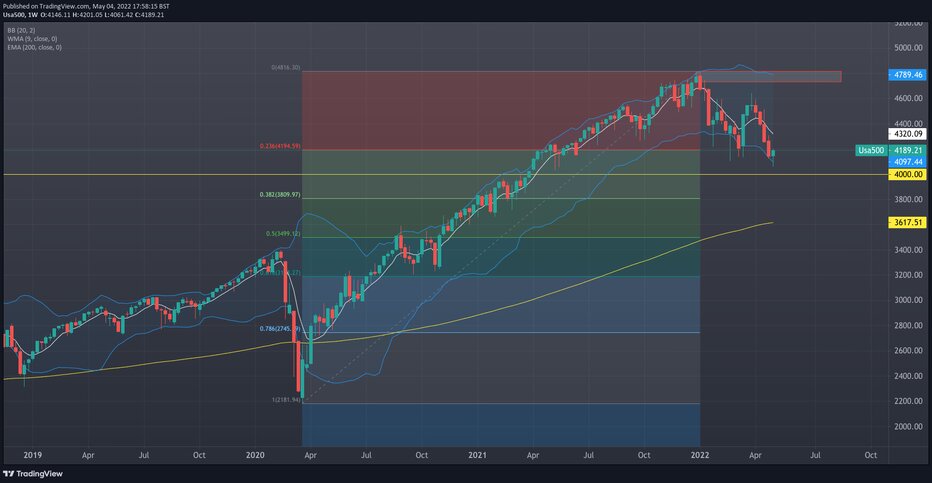
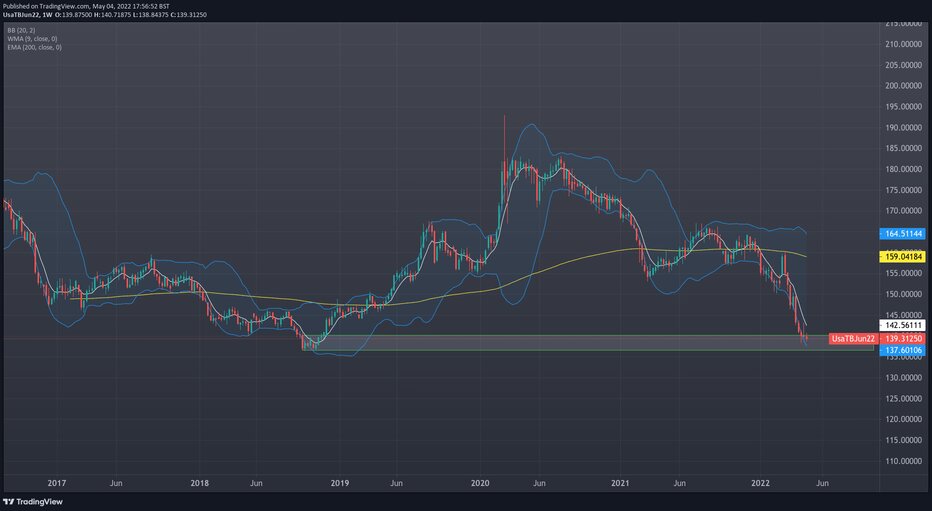
The above charts attest to PTJ’s assessment that currently and under the rate hike cycle, the TLT and S&P500 are not looking like they are a potential buy any time soon. The TLT which tracks the 20-year bond in an ETF is at an interesting zone and previous swing lows, but with the US 10-year yields breeching 3% yesterday and expectations for more than one 50bps rate hike, plus several 25bps rate hikes throughout the year, yields going higher mean fixed income products like the TLT should be going lower. The S&P500 has had the worst start to a year than we’ve seen in many trading cycles, and currently is hovering above the 4000 level. The only significance to 4000 is that it is a round number and traders are drawn to trading at round numbers. Investors will be eyeing the possibilities of a deeper retrace with value found below 3500.
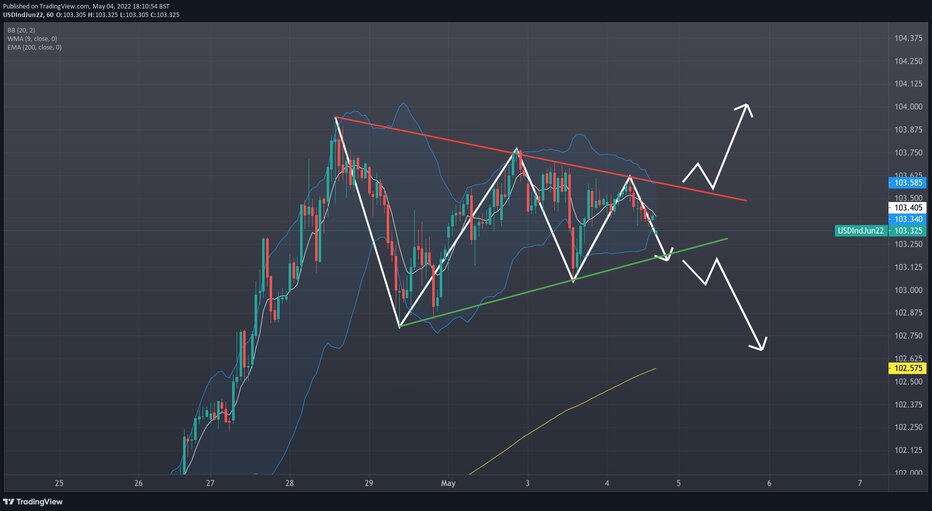
Before we were in a US rate hike cycle, the investing community could rely on the daily 50 ema to be a good dynamic support as we bought the dip. After today, we may be using that average as a level to sell the rips.
The biggest upset therefore is that we have high inflation for longer, but the Fed have run out of ideas or feel unable to tighten monetary policy, believing that their forward guidance and policy expectancy has done enough to turn the tide of monetary inflation. There is still a chance that supply chains come back to pre-pandemic levels of efficiency and we can reduce the commodity prices again. The markets have already moved significantly without any direct involvement from the central bank.
This is however not my base-case scenario. I believe the Fed will go through with their policy changes to save face and force the yields higher at the short end, flattening the curve and inverting it further in comparison to the long-term yields. Dropping the equity markets and risk assets and causing a recession. If I am wrong, we still have to wait for the daily chart at least to prove me wrong by creating some higher swing highs and lows.
See real-time quotes provided by our partner.
Forex major crosses have been grinding into an ever-smaller apex for the last week. The US dollar index is a basket of currency pairs with the weighting towards the EURUSD. The situation in Europe isn’t great though we had some relatively good news today. The war in Ukraine and possible fuel sanctions across the union will create uncertainty, possibly a recession and economic damage. In which case the euro will continue to fall against the US dollar. Monetary policy between the Fed and ECB is like that of the Fed and BoJ. Massive divergence in rate hike cycle, monetary tightening etc. The US dollar index should be going higher based on those two carry trades alone. The US trade deficit grew in March to $109.8 billion, according to the US Census Bureau. Exports in March amounted to $241.7 billion, rising $12.9 billion or 5.6% from February, while imports reached $351.5 billion, increasing $32.9 billion or 10.3% compared to the figures recorded in the previous month. This is how the world receives US dollars for their foreign exchange funds. Which they use to purchase oil etc. It is also a negative force on the US GDP as we have seen in previous GDP readings.
The commodity-based forex currencies are indicating that this is a risk-on day today, but we have had China and Japan on bank holiday and commodities generally do better in an inflationary period. We should revisit this after the Feds press conference and see if the market still believes it’s a risk on day.
The US EIA weekly crude stocks came in higher than expected with a build of 1.302million barrels. Crude production came in at the previous levels at 11.9million barrels. Distillates which allude to commercial activity were in a draw and so were the gasoline stocks which allude to personal activity.
See real-time quotes provided by our partner.
If you are an energy trader, the next move out of this wedge, could make or break your year. In terms of a swing trade, this could be the move that takes us back to $80, or up to the recent highs around $120. What we do know is that the asset is running out of runway with regards to how tight a range they can trade it into. Commercials on the COT data have not added to their shorts in a meaningful way, and at elevated prices they are going to keep producing more and will have a great year in terms of earnings for doing so. If the commercials are not hedging, my theory of the direction in travel into the wedge, leading to a continuation to the downside my not be valid.