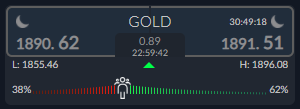
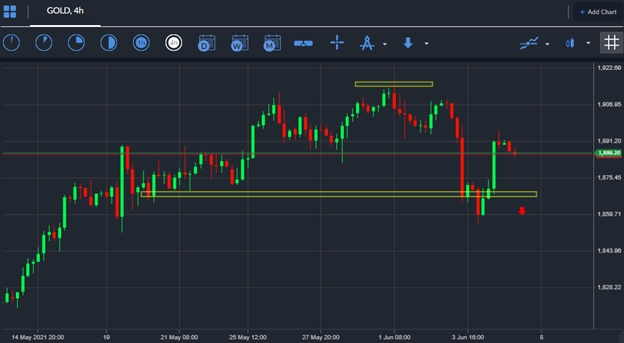
The price of gold had a hugely volatility week last week as the yellow metal hit a new multi-month trading high and subsequently reversed towards the $1,855 level, and then bounced back towards the $1,900 level.
Looking at the week ahead, the stage is set for further gains in gold as the technical surrounding gold are still extremely firm. Additionally, the strength of dip-buying demand for the metal around $1,855 hints at further big gains ahead for the yellow metal.
Inflationary pressure has traditionally been a friend to gold, so has the constant theme of more QE for longer since the start of the COVID-19 pandemic. Should we see the US CPI inflation number running hot this week then the price of gold is likely to run above the $1,900 level towards the best levels of last year.
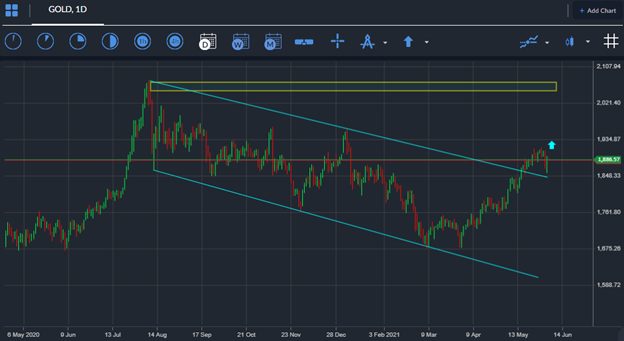
Impressively, gold tested back towards a key trendline last Friday and bounced sharply from the mentioned trendline. Historically, retests and bounces from key technical areas often signal a continuation of the prevailing trend.
It is also worth noting that gold has spent three-weeks above its key 200-day moving average, and its 52-week moving average. Furthermore, the William’s Alligator indicator is issuing a powerful buy signal right now, which hints at more medium-term upside.
Current sentiment metric towards gold shows a clear bullish bias. The ActivTrader Market Sentiment tool shows that some 62 percent of traders are bullish towards the yellow metal right now, marking an 11 percent increase since last week. Retail traders are often on the wrong side of the market, and more so when large retail sentiment skews form.


